脑损伤
-
Figure 1 | Representative images of FBP with filter paper on organotypic cultures.
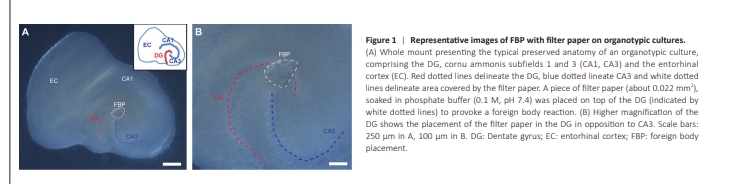
In this work, we aimed at evaluating if FBP could be used as a model to induce focal damage in the DG of OTCs. For this matter, we prepared OTCs from P4– P5 Wistar rat pups and evaluated viability and cell responses at two different time points. FBP was performed at DIV 14. OTCs were fixed for 2 days (DIV 16) or 7 days (DIV 21) after FBP. A rectangular piece of filter paper (approximately 0.022 mm2 ) soaked in PB (0.1 M, pH 7.4) was placed on the surface of the suprapyramidal blade of the DG close to the crest (indicated by a white dotted line) to provoke a foreign body reaction (Figure 1A). Under bright light microscopy, the gross morphological structure of OTCs including the DG was preserved, indicating that FBP did not change their viability. Figure 1B shows a higher magnification image of the DG where the filter paper was placed. Given the sticky consistency of OTCs, the foreign body (FB) remained in place for the rest of the experiment.
Figure 2 | Foreign body placement (FBP) with filter paper evokes a foreign body reaction associated with increased reactivity of astrocytes.
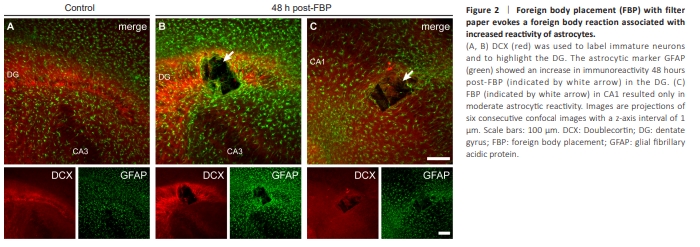
Figure 3 | Foreign body placement (indicated by arrows) with filter paper evokes a reaction of immature neurons after 48 hours.
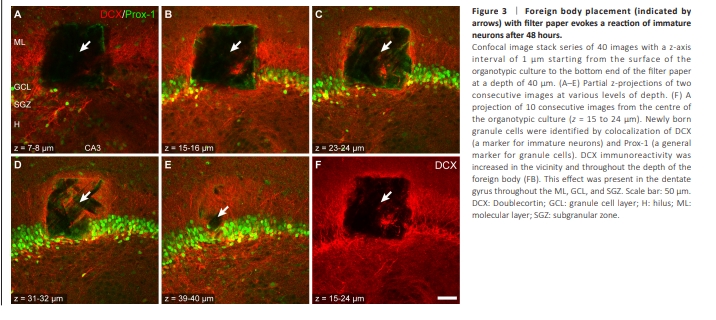
By 48 hours after FBP, the FB had produced a rectangular tissue gap and filled the place of the tissue (Figure 2). The tissue gap had the dimensions of the FB and a depth in the z-axis of at least 40 μm (Figure 3). The filter paper was preserved within at least two adjacent 20 μm sections in the fixed OTCs. Thus, FBP provoked local damage in OTCs as shown by the well-defined gap left in the tissue without compromising their viability as shown by the preserved anatomyTo evaluate potential cell reactions associated with damage and plasticity in the vicinity of the FBP, astrocytes, and young cells were immunohistochemically labeled through GFAP and DCX, respectively. FBP provoked a reaction associated with increased astroglial reactivity and an increase in the DCX-immunoreactive (DCX-ir) signal comprising all layers of the DG (Figure 2B). These reactions readily occurred 48 hours after FBP. Astroglial reactivity was evidenced by a hypertrophic phenotype characterized by an increased signal for GFAP, intense cell bodies, thickened processes and a stellate-like morphology (Figure 2B; Escartin et al., 2021). Astrocytic reactivity was also detected 48 hours after FBP on the surface of the CA1 pyramidal layer (Figure 2C). An increase in the astrocytic reaction was present throughout the depth of the OTC (Additional Figure 1). Notably, FBP provoked a region-dependent increase in DCX-ir in the DG (Figure 2B, bottom panel), but this increase was not observed after FBP in CA1 (Figure 2C, bottom panel). The increase in DCX-ir in the DG area after FBP in the DG was reproducible and could be observed throughout the depth of the OTC (Figure 3). DCXir consistently increased in all OTCs at 48 hours post-FBP. Increased DCXir was restricted to the DG and comprised labeled GCs, i.e., GC somata and fibers in the SGZ, the apical dendrites in the GCL and the dendritic trees of GCs throughout the ML of the DG. DCX-ir fibers were also present in the hilar region.
Figure 4 | Increase in neuron-associated immunoreactivity following FBP in DG is not general but restricted to markers of immature cells and is transient.
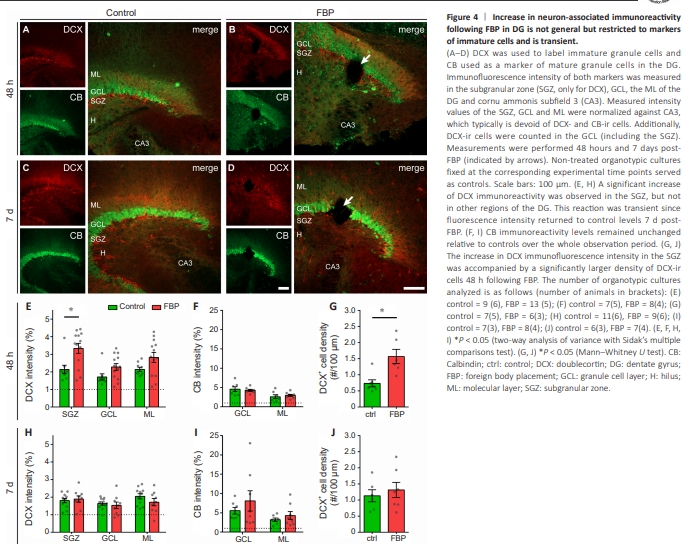
We analyzed DCX, a marker of immature GCs in the DG and CB, a calcium buffering protein that is a marker of mature GCs, to further evaluate whether neuron-associated immunoreactivity was increased overall (Figure 4; Jungenitz et al., 2014). The immunofluorescence intensity of both markers was measured in the SGZ, GCL, and ML of the DG (SGZ was not considered for CB). Additional measurements were performed in CA3, which is typically devoid of DCX- and CB-ir cells and therefore represents unspecific background noise for internal normalization. The identified DCX-ir cells in the GCL (including the SGZ) were counted. Measurements were performed 48 hours (Figure 4A and B) and 7 days (Figure 4C and D) after FBP (indicated by white arrows). Nontreated OTCs served as controls. At this time point (DIV 16), DCX-ir cells in the controls were restricted to a thin layer in the SGZ, with their dendrites reaching the ML, whereas CB-ir cells populated the GCL, and their dendrites were also found in the ML (Figure 4A). At 48 hours after FBP, two-way ANOVA revealed a significant increase in DCX immunoreactivity in the SGZ but not in other regions of the DG (effect of region: P = 0.01; effect of treatment: P = 0.0001; Sidak’s multiple comparisons test: P = 0.003 in the SGZ; Figure 4E). This reaction was transient since the fluorescence intensity returned to control levels at 7 days post-FBP (Figure 4H). CB immunoreactivity levels remained unchanged relative to those of the controls throughout the entire observation period (Figure 4F and I). Counting of DCX-ir cells revealed that the increase in DCX immunofluorescence intensity in the SGZ was accompanied by a significant increase in the density of DCX-ir cells at 48 hours following FBP (Mann?Whitney U test, P = 0.008), which was not sustained at 7 days post-FBP (Figure 4G and J). These results show that the increase in DCX-ir was accompanied by an increase in the number of DCX-positive cells surrounding the FB and that this effect was transient as it was observed at 48 hours but not at 7 days after FBP.
Figure 5 | FBP in the dentate gyrus induces a reduced transition rate of newly born granule cells from the expression of DCX (red) only to a co-expression with CB (green).
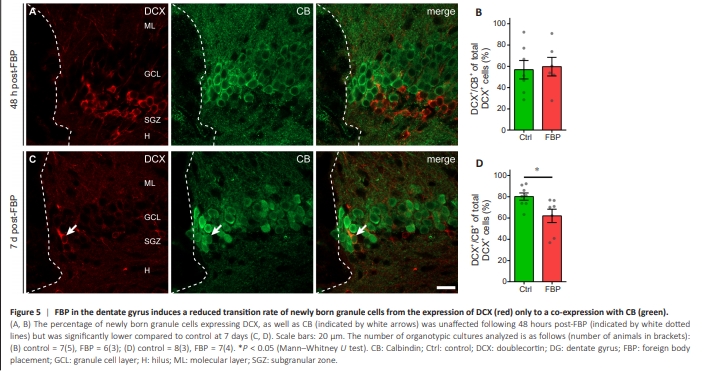
To evaluate whether the maturation rate of young neurons was different in OTCs with FBP than in control OTCs we counted the number of cells immunopositive for the immature neuronal marker DCX, the marker of mature neurons CB, and the colocalization of both within the z depth of sectioned OTCs (Figure 5). The coexpression of DCX and CB in the nbGCs is characteristic of a transient stage during maturation, namely, the end of the DCX-regulated period of structural maturation and dendritic growth and the beginning of the period of spinogenesis and functional integration (Jungenitz et al., 2014, 2018; Radic et al., 2017). Figure 5A and B shows that the percentage of newborn/ young GCs expressing DCX, as well as CB, was unaffected at 48 hours postFBP (indicated by white dotted lines) but was significantly lower than that of the controls at 7 days (Figure 5C and D). Thus, a lower rate of DCX and CB coexpression at 7 days after FBP (DIV 21) indicates the reduced maturation of nbGCs in the surroundings of the FB.
Figure 6 | FBP and retrovirally labeled nbGCs.
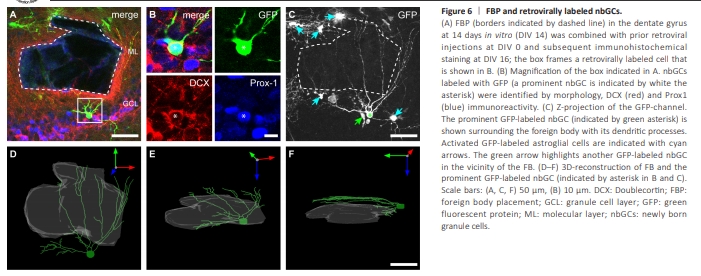
Figure 7 | Time-lapse series of identified retrovirally labeled nbGCs.
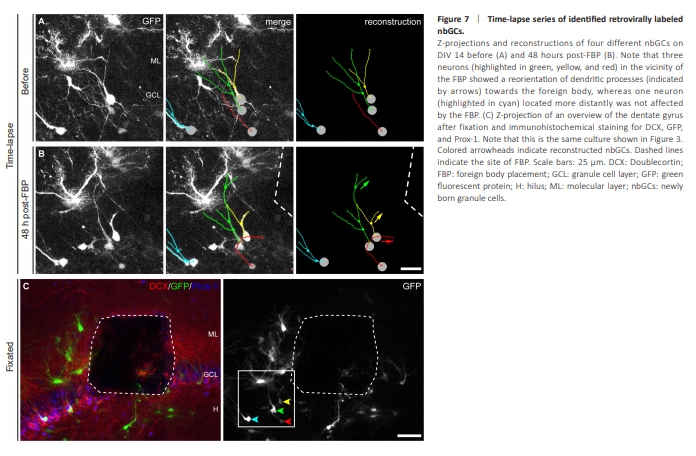
RV labeling enables live imaging of growing and maturing nbGCs in OTCs (Radic et al., 2017b). RV-GFP was locally injected into the DG of OTCs directly after preparation at P4–P5 (DIV 0) to label mitotic cells (van Praag et al., 2002; Radic et al., 2017b) and to further evaluate their potential plastic responses to the FB. Live-imaging of the DG was obtained at DIV 14, and FBP was performed in the suprapyramidal DG directly after imaging. At 48 hours after FBP, GFP-labeled nbGCs in the direct vicinity of the FB exhibited increased growth of dendrites toward the FB (Figure 6). In 13 OTCs, we identified 34 GFP-labeled nbGCs that could be observed directly before and at 48 h after FBP. Seven of 18 successfully GFP-labeled nbGCs located in the direct neighborhood of the FB showed dendritic growth and orientation toward the FB, whereas 16 GFP-labeled nbGCs located at least 150 μm apart from the FB appeared unaffected. Another three GFP-labeled nbGCs located close to the FB exhibited some loss of dendritic branches, probably due to direct physical damage. In addition, GFP-labeled astrocytes presented an increase in processes, including growth toward the FB, which was consistent with the immunohistochemical astroglial activation observed after FBP. Following fixation, the GFP signal was intensified by immunohistochemistry. GFP-labeled nbGCs were identified by morphology and coimmunoreactivity for Prox-1 and DCX (Figure 7). Dendrites of identified nbGCs were frequently observed in close vicinity to FBs, including nbGCs with several dendrites surrounding the FB, as revealed by 3D reconstructions. These results show that as soon as 48 hours after FBP, newly born cells in close vicinity to the FB, but not away from it, display plastic responses involving increased growth of dendrites oriented toward the FB (Figure 7A and B).