神经损伤与修复
-
Figure 2 | Induction of OHT via magnetic microbead injection, and RGC loss.
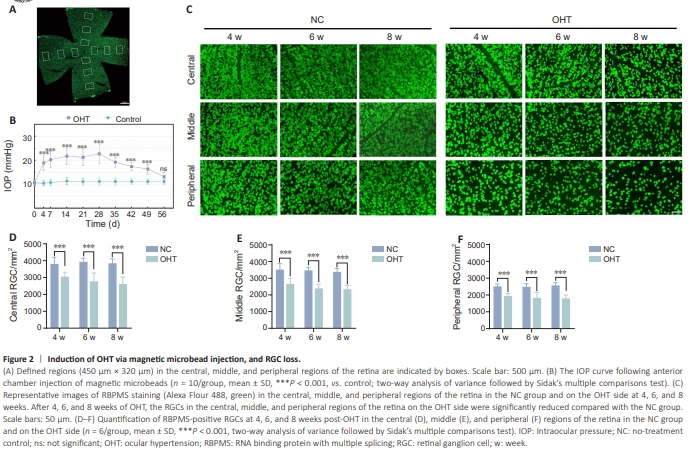
Magnetic microbeads were unilaterally injected into the left anterior chamber of the eye of adult C57BL/6 mice to induce OHT, while the untreated right eye served as a control. There was no significant difference in baseline IOP between the eye with OHT and the NC eye. A notable increase in IOP was observed on the fourth day following magnetic microbead injection, with the OHT eyes exhibiting a significantly higher IOPs than the eyes in the NC group (NC vs. OHT: P < 0.0001). Weekly IOP measurements were taken thereafter. In our glaucoma model, IOP peaked at 4 weeks post-OHT (NC vs. OHT: P < 0.0001). Subsequently, the IOP gradually decreased, although a statistically significant difference persisted between the two groups until the 7th week post-injection (NC vs. OHT: P < 0.0001). By the 8th week, no significant difference in mean IOP was observed between the OHT eyes and eyes in the NC group (Figure 2B). Next, the loss of RGCs resulting from OHT was quantified. Immunostaining using an antibody against RBPMS allowed for RGC quantification across different regions of the retina. After 4 weeks of elevated IOP, a significant decrease in the number of RGCs was observed in the central, middle, and peripheral areas of the retina compared with the same regions in the NC group (NC vs. OHT: P < 0.0001). As the duration of elevated IOP increased to 6 and 8 weeks, RGC loss worsened across all retinal regions (Figure 2C–F). These results underscore the effectiveness of anterior chamber injection of magnetic microbeads in inducing chronic IOP elevation because it resulted in a 20%–33% loss of RGCs in mice, confirming its value as an OHT model.Briefly, mice were deeply anesthetized and transcardially perfused with 0.9% sodium chloride solution, followed by 4% paraformaldehyde, at weeks 4, 6, or 8. Subsequently, the eyes were excised and fixed in 4% paraformaldehyde for 2 hours at room temperature. The intact retinas were dissected and subjected to four radial incisions, creating a petal-like shape. The retinas were permeabilized using 2% Triton X-100, followed by a 2-hour blocking step with 5% goat serum (Boster, Wuhan, China), and subsequently incubated overnight at 4°C with an anti-RNA binding protein with multiple splicing (RBPMS) antibody (rabbit, 1:100, ProteinTech, Rosemont, IL, USA, Cat# 15187-1-AP, RRID: AB_2238431). Following three washes, the retinas were subjected to a 2-hour incubation at room temperature with a goat anti-rabbit IgG secondary antibody labeled with Alexa Fluor 488 (1:500, Cell Signaling Technology, Danvers, MA, USA, Cat# 4412, RRID: AB_1904025). Finally, the retinas were flattened and mounted on glass slides. Images were obtained with a panoramic scanning microscope (Tissuefaxs, TissueGnostics, Vienna, Austria) using a 20× objective. RGCs were quantified following established protocols (Wu et al., 2020; Chen et al., 2022). In all quadrants, 12 regions (450 μm × 320 μm) were evaluated at equidistant points (1/6, 3/6, and 5/6 of the retinal radius) from the optic disc (each region was assessed three times at these distances) (Figure 2A)
Figure 3 | Neuron numbers and neuronal soma size in the LGN, SC, and V1 regions after OHT.
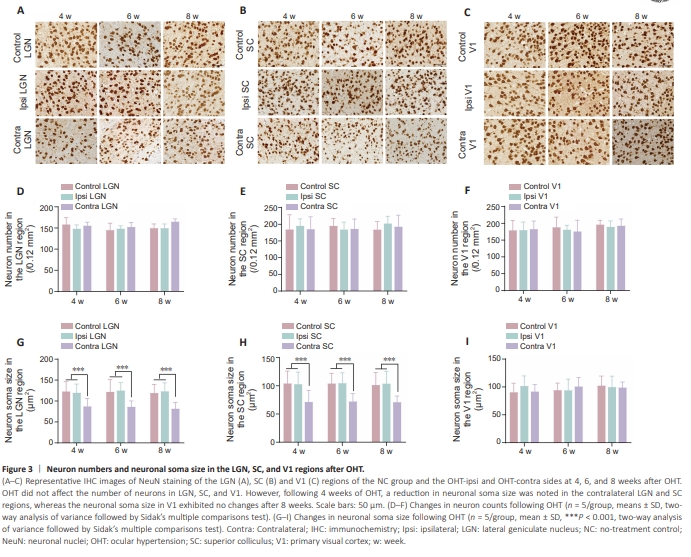
Neurons serve as the foundation for creating intricate circuits and processing/ transmitting information within the CNS (Koch and Segev, 2000). Therefore, we initially investigated whether OHT had an impact on total neuron counts and neuronal soma size. The neuron-specific marker NeuN was used to stain neurons (Figure 3A–C). Our findings indicated that, irrespective of the duration of elevated IOP (4, 6, or 8 weeks), the number of neurons in the LGN, SC, and V1 regions did not significantly differ among the three groups (OHT-contra/ipsi and NC) (Figure 3D–F). Interestingly, following a 4-week increase in IOP, we observed a decrease in neuronal soma size within the LGN and SC regions contralateral to the OHT eye compared with the ipsilateral side and the NC group (NC vs. OHT-contra: P < 0.0001, OHT-ipsi vs. OHT-contra: P < 0.0001; Figure 3G and H). This reduction in soma size persisted at 6 and 8 weeks post-OHT surgery in the contralateral LGN and SC regions (Figure 3G and H). Notably, there were no significant differences in soma size across the three time points (4, 6, and 8 weeks) in the contralateral LGN and SC regions. Conversely, within the V1 region, no significant changes in neuron soma size were observed contralateral to the OHT eye, even after 8 weeks of sustained IOP elevation, compared with the ipsilateral side and the NC group (Figure 3I). Thus, chronic OHT persisting for 4 weeks or more could result in a decrease in neuronal soma size in the LGN and SC regions contralateral to the OHT eye.
Figure 4 | Excitatory/inhibitory pre/postsynaptic protein marker VGlut1/PSD95/VGAT/gephyrin staining in the V1 region after unilateral OHT
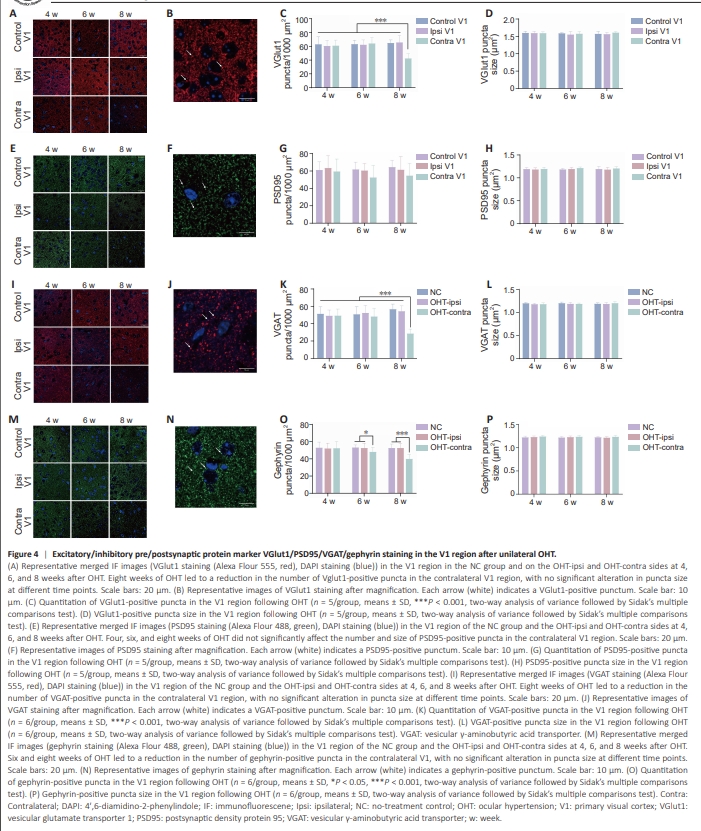
Initially, we asked whether the size or density of VGlut1 puncta changed in response to elevated IOP (Figure 4A–D). We detected no signs of atrophy or swelling in glutamatergic presynaptic terminals, as the punctum size remained consistent in the V1 region across the three groups at varying time intervals. However, a notable decrease in VGlut1 punctum density was observed in the V1 region contralateral to the OHT eye compared with the other two groups in postoperative week 8 (NC vs. OHT-contra: P < 0.0001, OHT-ipsi vs. OHTcontra: P < 0.0001). Neither the size nor the density of PSD95-positive puncta exhibited significant changes, even after sustaining high IOP for 8 weeks. Notably, there was a marginal decrease in PSD95-positive punctum density in the OHT-contra V1 region after 6 and 8 weeks of sustained high IOP in comparison with that in the other groups (although this difference was not statistically significant) (Figure 4E–H). Subsequently, we analyzed variations in GABAergic synapses. We found no significant differences in VGAT or gephyrin puncta size among the three groups at postoperative weeks 4, 6, and 8. However, following 8 weeks of OHT, a notable decrease in VGAT punctum density was noted in the contralateral V1 region (NC vs. OHT-contra: P < 0.0001, OHT-ipsi vs. OHTcontra: P < 0.0001; Figure 4I–L). Additionally, we observed a decrease in the density of the inhibitory postsynaptic terminal marker gephyrin at 6 weeks (NC vs. OHT-contra: P = 0.0223, OHT-ipsi vs. OHT-contra: P = 0.0416) and 8 weeks (NC vs. OHT-contra: P < 0.0001, OHT-ipsi vs. OHT-contra: P < 0.0001) post-OHT (Figure 4M–P).
Figure 5 | Changes in dendritic spines in the V1 region after unilateral OHT
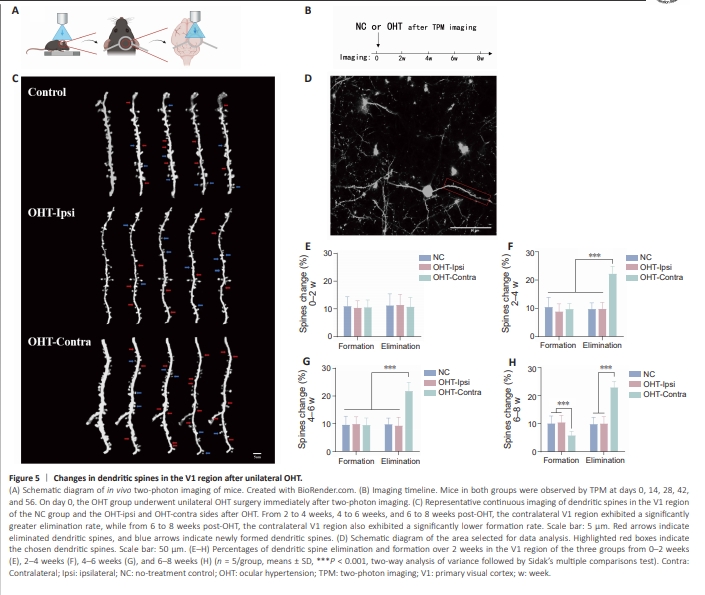
The observed decrease in the number of synapses in V1 described in the preceding section indicated a potential alteration in synaptic plasticity. Synaptic plasticity encompasses not only modifications in synaptic structure and quantity, but also, crucially, formation and elimination of dendritic spines (Chidambaram et al., 2019). To determine whether OHT triggers changes in dendritic spine plasticity, dendritic spines on L2/3 pyramidal neurons in the visual cortex were repetitively imaged using transcranial TPM over a 2-week period extending up to 8 weeks post-OHT surgery (Figure 5A and B). In the contralateral V1 region, 10.64% ± 2.57% of dendritic spines were newly formed and 10.82% ± 3.32% had been eliminated 2 weeks after OHT. Comparable rates of formation and elimination were observed in the OHTipsi VI region and NC group during this period (OHT-ipsi: formation: 10.43% ± 2.49%, elimination: 11.50% ± 3.74% vs. NC: formation: 11.04% ± 3.31%, elimination: 11.29% ± 4.12%). From 2 to 4 weeks, 4 to 6 weeks, and 6 to 8 weeks post-OHT, the contralateral V1 region exhibited a significantly greater dendritic spine elimination rate than the ipsilateral and control V1 regions (2–4 weeks: NC vs. OHT-contra: P < 0.0001, OHT-ipsi vs. OHT-contra: P < 0.0001; 4–6 weeks: NC vs. OHT-contra: P < 0.0001, OHT-ipsi vs. OHT-contra: P < 0.0001; 6–8 weeks: NC vs. OHT-contra: P < 0.0001, OHT-ipsi vs. OHT-contra: P < 0.0001). Unexpectedly, from 6 to 8 weeks, the rate of dendritic spine formation decreased, with the contralateral V1 region exhibiting a significantly lower rate than that seen in the ipsilateral and control regions (NC vs. OHT-contra: P < 0.0001, OHT-ipsi vs. OHT-contra: P < 0.0001). Collectively, these findings suggested a loss of dendritic spines in the V1 contralateral to the OHT eye (Figure 5C–H).
Figure 6 | Reactive astrocytes/microglia and TNF-α/IL-1β expression levels in the LGN, SC, and V1 regions after unilateral OHT.
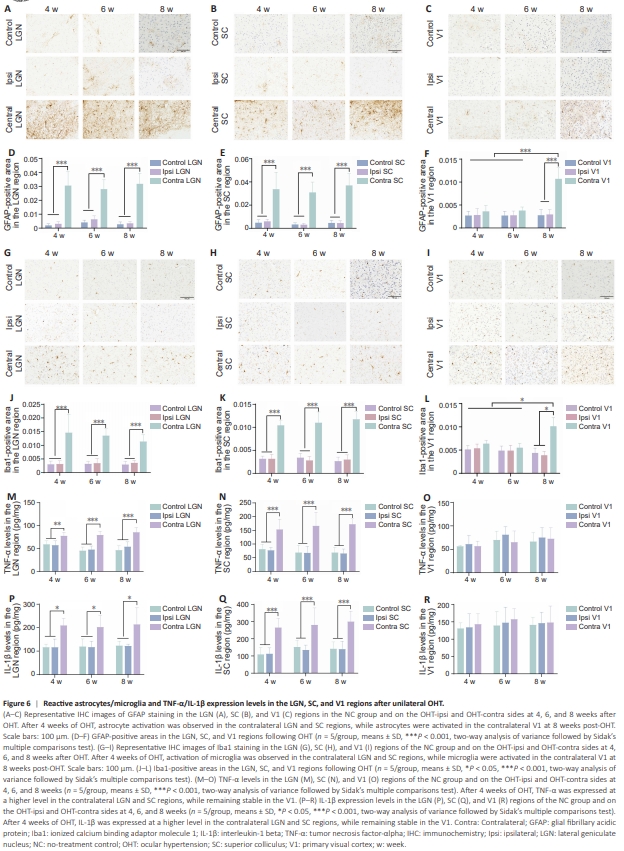
Given the crucial involvement of glial cells in synaptic formation and development, we used specific glial cell markers (GFAP and Iba1) to evaluate the total area occupied by reactive astrocytes (Figure 6A–F) and activated microglia (Figure 6G–L). We found that there was a significant increase in the area occupied by reactive astrocytes and microglia in the contralateral V1 region compared with the ipsilateral V1 region and the V1 region in the NC group only after 8 weeks of OHT (NC vs. OHT-contra: P < 0.0001, OHT-ipsi vs. OHT-contra: P < 0.0001; Figure 6F and L). Consistent with neuronal alterations, glial cell responses were enhanced in the SC and LGN regions as early as 4 weeks following OHT. After 4 weeks of sustained IOP elevation, we observed significantly larger GFAP- and Iba1- positive areas in the contralateral LGN and SC regions than in the OHT-ipsi region and NC group (4 weeks-GFAP: NC vs. OHT-contra: P < 0.0001, OHTipsi vs. OHT-contra: P < 0.0001; 4 weeks-Iba1: NC vs. OHT-contra: P < 0.0001, OHT-ipsi vs. OHT-contra: P < 0.0001; Figure 6D, E, J, and K). Nevertheless, thepercentages of reactive astrocytes and microglia in the contralateral LGN and SC were similar at all time points tested (4, 6, and 8 weeks); no significance test was performed. To investigate the potential link between synaptic alterations and neuroinflammatory responses mediated by activated glial cells, we analyzed the levels of the inflammatory cytokines IL-1β and TNF-α. Unexpectedly, when elevated IOP was sustained for nearly 8 weeks, there was no significant increase in the expression levels of IL-1β and TNF-α in the V1 region. However, in the subcortical region, at 4 weeks post-OHT surgery, elevated levels of TNF-α and IL-1β were observed in the contralateral LGN and SC regions compared with those on the ipsilateral side and in the control group (4 weeks-TNF-α: NC vs. OHT-contra: P = 0.0085, OHT-ipsi vs. OHT-contra: P = 0.0037, SC: NC vs. OHT-contra: P = 0.0004, OHT-ipsi vs. OHT-contra: P = 0.0002; 4 weeks-IL-1β: NC vs. OHT-contra: P = 0.0102, OHT-ipsi vs. OHT-contra: P = 0.0104, SC: NC vs. OHT-contra: P = 0.0002, OHT-ipsi vs. OHT-contra: P = 0.0007). The expression levels of inflammatory cytokines in the contralateral LGN and SC regions remained stable from 4 to 8 weeks (Figure 6M–R).