神经退行性病
-
Figure 1 | LRP1 expression is increased in the nigrostriatal system of a monkey model of PD induced by α-syn PFFs injection.
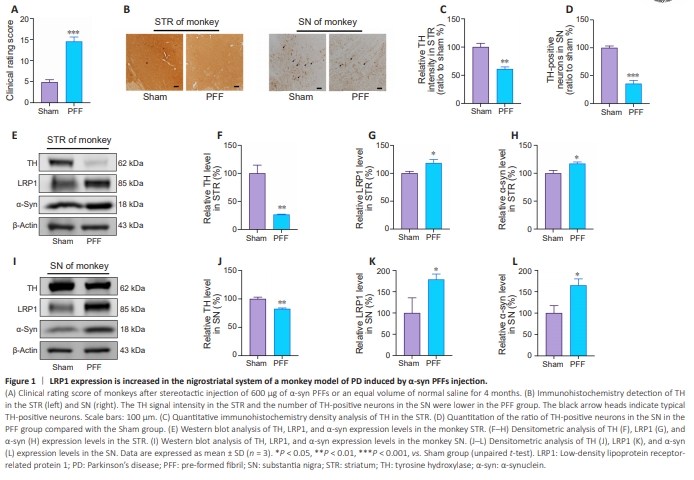
In this study, we stereotactically injected α-syn PFFs into the right STR of cynomolgus monkeys and C57/BL6 mice to construct α-syn PFFs–induced PD models. Motor deficit analysis (Chen et al., 2015; Yue et al., 2017) showed that the α-syn PFFs–inoculated monkeys exhibited obvious bradykinesia, limb movement disorders, and abnormal posture. The clinical rating scores of the α-syn PFFs–inoculated monkeys were greater than 10 and significantly higher than those of the control monkeys (P < 0.001). This was accompanied by significant loss (to 35.6%, P < 0.001) of TH-positive dopaminergic neurons in the nigrostriatal system (Figure 1A–D). Western blotting confirmed that, compared with the control monkeys, TH levels in the STR (to 26.5%, P < 0.01, Figure 1E and F) and SN (to 82.5%, P < 0.01, Figure 1I and J) of α-syn PFFs-inoculated monkeys were significantly reduced, indicating successfully establishment of the monkey PD model. Intriguingly, the LRP1 level was markedly elevated (to 118.3% in the STR, P < 0.05, Figure 1E and G; to 179.0% in the SN, P < 0.05, Figure 1I and K), accompanied by an increase in α-syn levels (to 117.0% in the STR, P < 0.05; to 164.9% in the SN, P < 0.05) in both the STR (Figure 1E and H) and the SN (Figure 1I and L) of PD monkeys.
Figure 2 | LRP1 expression is increased in the nigrostriatal system of a mouse model of PD induced by injection with α-Syn PFFs.

Next, visual gait analysis was performed to assess alterations in mouse motor function. Compared with the sham group, α-syn PFFs–inoculated mice exhibited disorganized gait patterns and a reduced ratio of normal step sequences (to 65.7%, P < 0.01; Figure 2A and B). In addition, the average speed of movement was reduced (P < 0.05), whereas the tripod support time significantly increased (P < 0.01; Figure 2C and D). These results demonstrate that α-syn PFFs–injected PD model mice developed significant movement disorders. Furthermore, 3,3′-diaminobenzidine tetrahydrochloride staining showed that TH density in the STR (to 68.7%, P < 0.05) and the relative numbers of TH-positive neurons in the SN (to 53.8%, P < 0.01) were significantly reduced in the PD model mice (Figure 2E–H). Similarly, western blot analysis showed that TH expression was reduced (to 59.0% in the STR, P < 0.05, Figure 2I and J; to the 52.1% in the SN, P < 0.001, Figure 2M and N). These results demonstrate successful establishment of the α-syn PFFs–induced PD mouse model. Consistently, compared with sham mice, a significant increase in LRP1 levels (to 130.3% in the STR, P < 0.05, Figure 2I and K; to 121.0% in the SN, P < 0.05, Figure 2M and O) was observed in PD mice, accompanied by upregulation of α-syn (to 154.5% in the STR, P < 0.05, Figure 2I and L; to 126.9% in the SN, P < 0.05, Figure 2M and P) in both the STR and the SN. These results demonstrate that the α-syn pathology induced by inoculating exogenous α-syn PFFs into the STR was transmitted in a retrograde manner to the SN in both PD monkeys and PD mice, and that LRP1 may mediate this process.
Figure 3 | Exogenous α-syn PFFs upregulate LRP1 expression in PC12 cells.
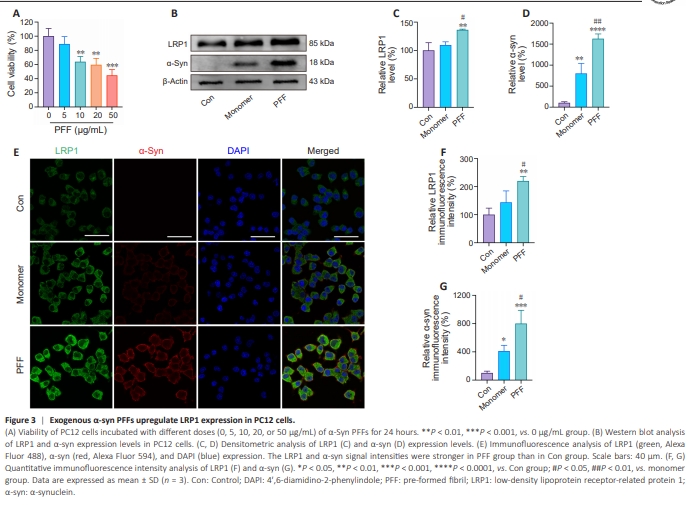
To confirm the relationship between α-syn and elevated LRP1 expression, we incubated PC12 cells with different concentrations of α-syn PFFs and analyzed cell viability by Cell Counting Kit-8 assay. The results showed that α-syn PFFs reduced cell viability in a dose-dependent manner. Because PC12 cell viability was significantly reduced when treated with 10 μg/mL α-syn PFFs (P < 0.01; Figure 3A), this concentration was used for subsequent experiments. Western blot analysis showed that treatment with exogenous α-syn PFFs increased α-syn expression (to 1627.2%, P < 0.0001) and LRP1 expression (to 136.2%, P < 0.01; Figure 3B–D) in PC12 cells. The ability of the anti–α-syn antibody to detect monomers and PFFs was evaluated by dot blot (Additional Figure 3). Confocal microscopy showed that PC12 cells took up both exogenous α-syn monomers and exogenous α-syn PFFs, although the cells treated with PFFs exhibited a more significant increase in LRP1 signal intensity (to 220.0%, P < 0.01; Figure 3E–G). Similar results were obtained when primary neurons were treated with α-syn monomers and PFFs (Additional Figure 4). These results suggest that LRP1 plays a role in α-syn uptake and propagation.
Figure 4 | LRP1 knockdown rescues the dopaminergic damage induced by exogenous α-syn PFFs.
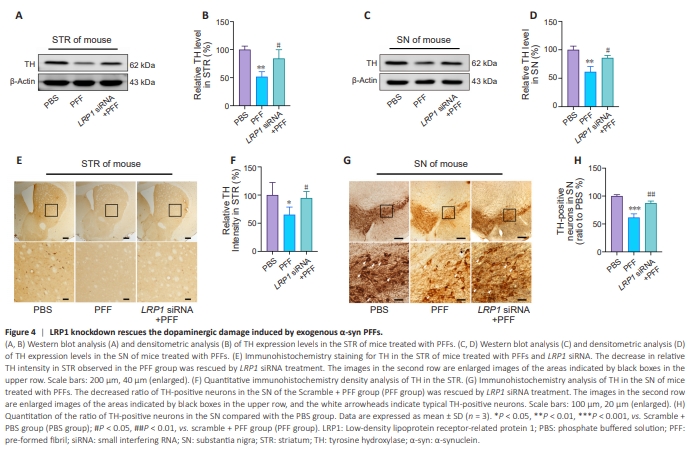
Expression levels of LRP1, a transmembrane receptor mainly expressed in the brain, are elevated in neurons of patients with PD, and this protein has been highlighted as a potential α-syn transporter (Wilhelmus et al., 2011). To determine whether the increased α-syn expression levels observed in the STR and SN of α-syn PFFs–inoculated monkeys and mice, as well as in α-syn PFFs–treated PC12 cells, were due to elevated LRP1 expression levels, LRP1 siRNA was used to silence LRP1 expression in vivo. Mice were injected with lentivirus carrying LRP1 siRNA through the tail vein, and 8 weeks later LRP1 knockdown was verified by western blot analysis (Additional Figure5). Thereafter, the mice were injected stereotactically in the STR with α-syn PFFs. Six weeks later, western blot analysis showed that, both in the STR and the SN of α-syn PFFs–inoculated PD mice, LRP1 knockdown significantly suppressed the reduction in TH induced by α-syn PFFs (P < 0.05 in STR, Figure 4A and B; P < 0.05 in SN, Figure 4C and D). In addition, 3,3′-diaminobenzidine tetrahydrochloride staining confirmed the rescue effect in α-syn PFFs–treated mice (P < 0.05 in STR, Figure 4E and F; P < 0.01 in SN, Figure 4G and H). These results demonstrate that LRP1 knockdown effectively rescued the damage to dopaminergic neurons induced by excessive exogenous α-syn.
Figure 5 | LRP1 suppression reduces the transmission of exogenous α-syn in vivo.
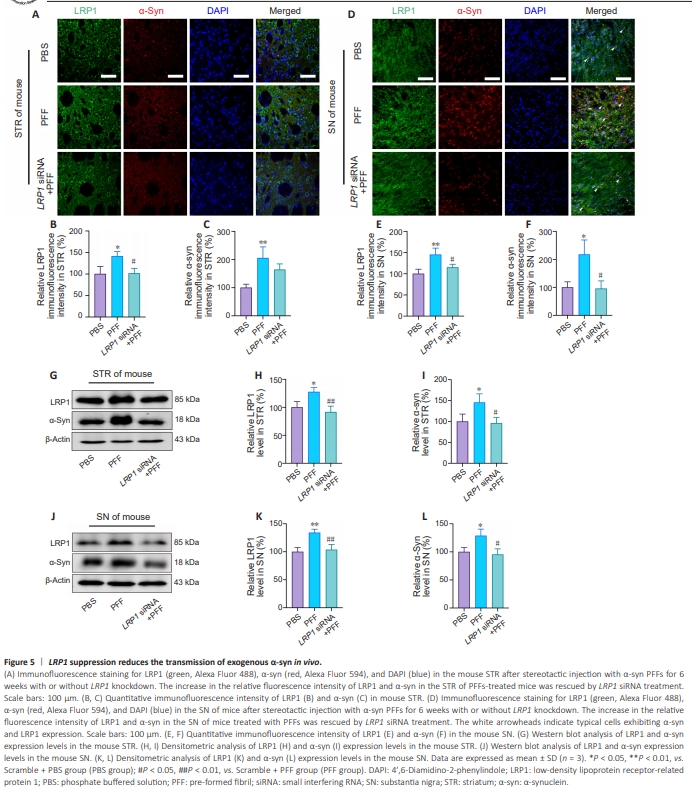
Given that LRP1 knockdown rescued α-syn PFFs–induced dopaminergic neuron damage, we next asked whether LRP1 was also critical for α-syn propagation in the brain. Immunofluorescence analysis showed a significant elevation in α-syn expression in both the STR (to 205.3%, P < 0.01) and SN (to 217.5%, P < 0.05) of mice injected with α-syn PFFs in the STR, whereas the relative α-syn fluorescence intensity in the SN was greatly diminished in LRP1 knockdown mice (P < 0.05; Figure 5A–F). These results were confirmed by western blot, which showed that LRP1 knockdown significantly reduced α-syn protein levels in both the STR (P < 0.05, Figure 5G–I) and the SN (P < 0.05, Figure 5J–L). Taken together, these data indicate that LRP1 downregulation robustly reduced pathological propagation of α-syn from the STR to the SN in mice.
Figure 6 | LRP1 mediates the uptake of α-syn PFFs by PC12 cells.

To determine whether α-syn uptake is mediated by LRP1, LRP1 siRNA was also used to silence LRP1 expression in vitro. Three different LRP1 siRNA sequences were transfected into PC12 cells at different concentrations (10, 20, and 40 nM) for 48 hours. Western blot analysis showed that 10 nM of LRP1 siRNA3 had the most significant knockdown effect on LRP1 (P < 0.001; Additional Figure 6); thus, it was selected for subsequent experiments. Western blot (Figure 6A–C) and immunofluorescence (Figure 6D–F) analyses demonstrated that LRP1 knockdown reduced α-syn expression levels in PC12 cells (P < 0.01, P < 0.05). These results suggested that LRP1 mediates the internalization of α-syn PFFs.
Figure 7 | LRP1 mediates α-Syn internalization via the α-syn N-terminus.
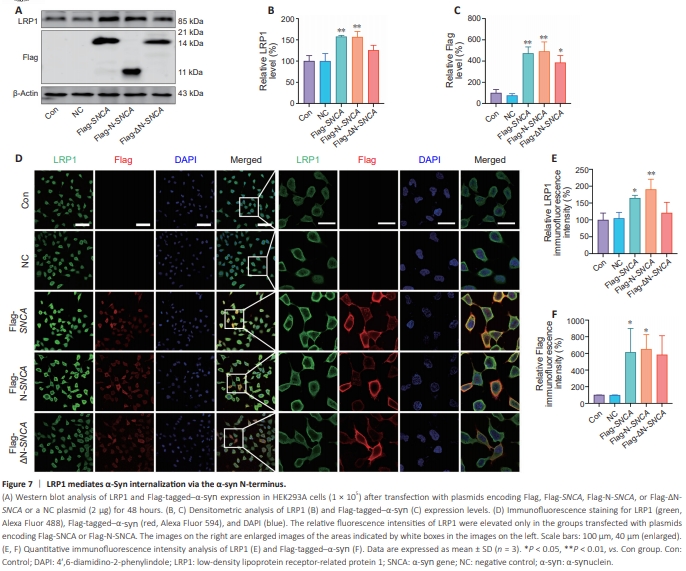
α-Syn protein contains three functional regions: the N-terminus, the NAC domain, and the C-terminus. To determine which region of α-syn is necessary for its LRP1-mediated internalization, HEK293A cells were transfected with plasmids encoding Flag, Flag-SNCA, Flag-N-SNCA, or Flag-ΔN-SNCA, or a NC plasmid, for 48 hours, and Flag-tagged–α-syn and LRP1 levels were determined by western blot (Figure 7A–C) and immunofluorescence (Figure 7D–F). LRP1 levels were significantly elevated in the cells transfected with plasmids encoding Flag-SNCA (P < 0.01 for the western blot results, P < 0.05 for the immunohistochemistry results) or Flag-N-SNCA (P < 0.01 for both the western blot and immunohistochemistry results), whereas no obvious changes were detected in the Flag-ΔN-SNCA group, indicating that the α-syn N-terminus is essential for LRP1-mediated α-syn internalization.
Figure 8 | Lysine residues in the α-syn N-terminus are vital for LRP1-mediated α-Syn internalization.
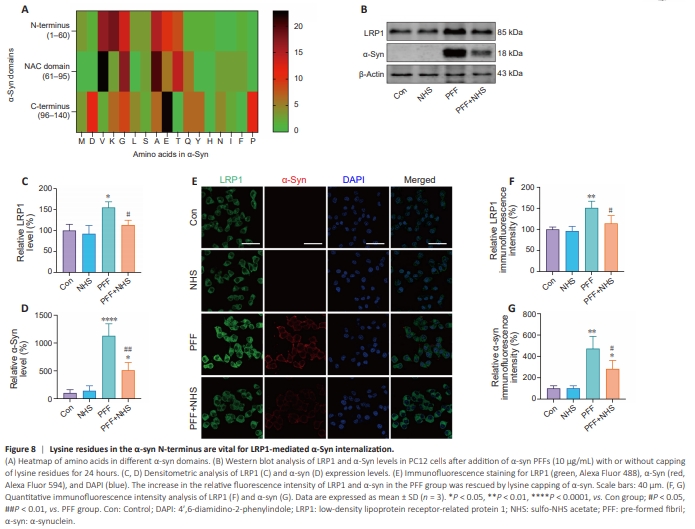
Heat maps of amino acid proportions in the different regions of α-syn showed that the lysine content was significantly higher in the N-terminus (18.33%) than in the NAC domain (2.86%) and C terminus (6.67%) (Figure 8A). To determine whether LRP1 interacts with α-syn through these lysine residues, α-syn PFFs were treated with NHS to cap the lysine residues. Western blot and immunofluorescence analyses demonstrated that, compared with the PFF group, capping the lysine residues there significantly suppressed LRP1 (P < 0.05 for both the western blot and immunohistochemistry results) and intracellular α-syn levels (P < 0.01 for the western blot results, P < 0.05 for the immunohistochemistry results) (Figure 8B–G). These results show that capping the lysine residues in α-syn PFFs effectively decreased α-syn and LRP1 expression in PC12 cells, indicating that lysine residues play a key role in LRP1- mediated α-syn uptake and transmission. Accordingly, we conclude that LRP1 mediates α-syn internalization via its N-terminal lysine residues.