脊髓损伤
-
Figure 2 | The identification of RC-MSCs-CMDiI.

To determine the efficiency of labeling MSCs with SPIONs agents, we assessed the intracellular uptake of iron in MSCs using PB staining after 24 hours of RC incubation (Figure 2A). We observed that nearly all MSCs were labeled with RC. To determine the efficiency and status of CMDiI-labeled RC-MSCs, we used immunofluorescence to label the membrane protein marker CD90 on MSCs. The colocalization rate of CMDiI with CD90 on RC-MSCs was 100% (Figure 2B), and the labeling process did not affect the morphology (Figure 2B) or proliferation capacity (Figure 2C and D) of the RC-MSCs.
Figure 3 | Assessment of functional recovery with TSCIS and DTI.
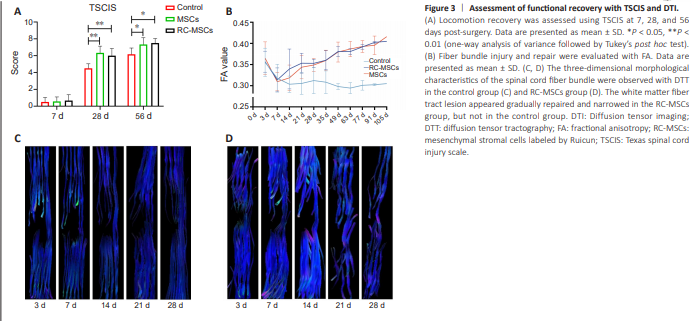
To evaluate the recovery of motor function in the dogs, we use the TSCIS. As shown in Figure 3A, the TSCIS of the control group was slightly increased to 5.80 ± 0.84 at 56 days post-surgery compared to day 7. Compared with control group, the MSCs and RC-MSCs groups showed functional restoration in ASCI dogs at 8 weeks after treatment. There was no statistical difference in TSCIS between the MSCs and RC-MSCs groups, indicating that RC-MSCs did not affect repairability.There were no differences between the MSCs and RC-MSCs groups in FA at any time point (all P > 0.05; Figure 3B). RC labeling of MSCs did not impact the spinal cord repair in our ASCI model. DTT showed that white matter fiber tracts were broken and sparse on day 3 after injury in all dogs. The fiber tract damage gradually increased with time in the control group, and the fibers completely lost their normal configuration and structure on day 21 (Figure 3C). In the MSCs and RC-MSCs groups, the lesion range of white matter fiber tracts did not increase further on day 7, and appeared gradually repaired and narrowed after day 14 (Figure 3D). TSCIS showed that the motion and sensory function of dogs in the MSCs and RC-MSCs groups recovered with time, whereas no recovery was observed in the control group. Pearson’s linear correlation analysis showed that TSCIS was positively correlated with FA in the ASCI treatment model (MSCs: r = 0.866, P < 0.001; RC-MSCs: r = 0.912, P < 0.001).
Figure 5 | Transplanted RC-MSCs in the spinal cord of ASCI dog model.

Low signal areas were observed in T2W and T2*W images at various time points in the RC-MSCs group beginning on day 3 after transplantation. From days 7 to 105, the volume of intramedullary low signal first increased and then decreased slowly, and the signal was observed on day 105 in T2*W images (Figure 4A). PB staining confirmed that the blue-stained iron oxide in the intramedullary T2* low signal region was in the interstitium of the spinal cord on both sides of the injury on day 105. Pathological and immunohistochemical analyses together confirmed that the hypointense signal was the RC-labeled viable MSCs for 4 weeks, which were traced up to day 105 in vivo (Figure 5).
Histological assessment showed the results of PB and eosin double staining of spinal cord sections at different time points. Within 42 days post-operation, all three groups exhibited round iron-rich cells, and only the RC-MSCs group displayed spindle-shaped iron-rich cells (Figure 5).
Figure 6 | Confocal images of MSCs at 7, 14, 21, and 28 days post-operation.

Figure 7 | MSCs and RC-MSCs treatments promote nerve regeneration in ASCI beagle model.
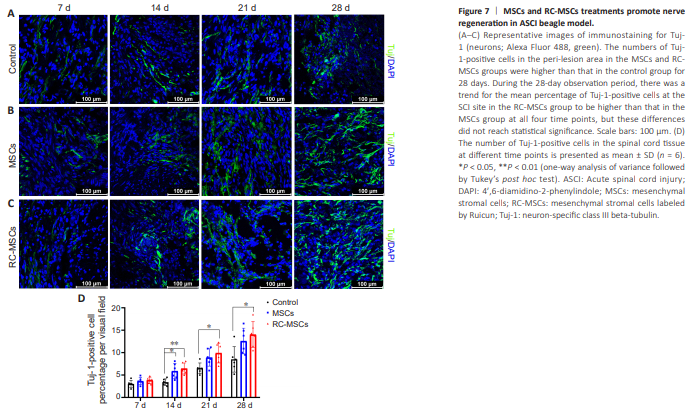
To verify MSC survival around the injured spinal cord tissue, we performed tricolor immunofluorescent co-staining analysis of DAPI/CMDiI/CD90 on spinal cord tissue. Positive cells were observed in both the RC-MSCs and MSCs groups at all time points within 28 days, whereas no positive cells were seen in the control group (Figure 6). To demonstrate the effect of MSC transplantation on SCI repair, we performed immunofluorescence detection of the neuronal marker Tuj-1 on spinal cord tissue at different time points within 28 days. Tuj-1 expression in the MSCs and RC-MSCs groups was higher than that in the control group on days 7, 14, 21, and 28. Quantitative analyses of Tuj-1-positive cells conducted at the same four time points indicated an increasing trend in the average proportion of Tuj-1-positive cells at the spinal cord lesion site in the RC-MSCs group compared with the MSCs group; however, this increase did not achieve statistical significance (Figure 7).