周围神经损伤
-
Figure 1 | Morphology and characteristics of iMSCs.
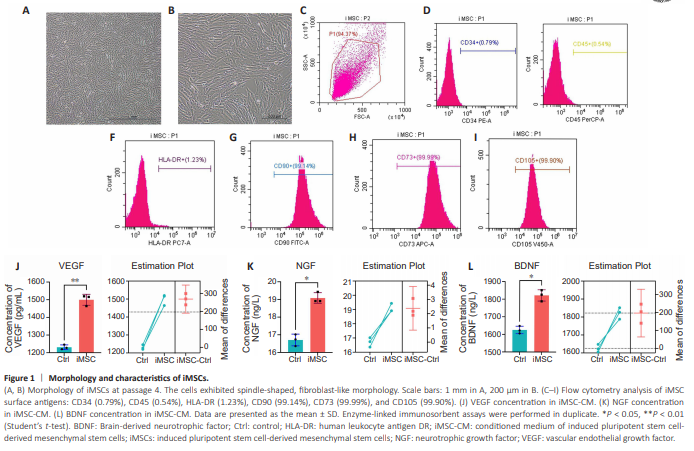
iMSCs exhibited spindle-shaped and fibroblast-like morphology (Figure 1A and B). Flow cytometry at passage 4 revealed positive expression of CD90 (99.14%), CD73 (99.99%), and CD105 (99.90%) and negative expression of CD34 (0.79%), CD45 (0.54%), and human leukocyte antigen-DR (HLA-DR; 1.23%) (Figure 1C– I). The low level of HLA-DR signifies low immunogenicity, in line with previous reports (Akle et al., 1981; Hu et al., 2015); Staining patterns for CD90, CD73, CD105, CD34, and CD45 were consistent with characteristics of MSCs (De Schauwer et al., 2012; Zahedi et al., 2017). To assess the paracrine ability of iMSCs, we analyzed iMSC-CM, detecting the angiogenesis-related VEGF and neural growth factors NGF and BDNF (Figure 1J–L). HLA-DR, an MHC class II molecule (Robinson et al., 2015), exhibited low-level expression, confirming low immunogenicity (Wassmer and Berishvili, 2020). Other markers of iMSCs also exhibited typical MSCs characteristics (Numan et al., 2017; Chen et al., 2019).
Figure 2 | iMSC-CM promotes angiogenesis in vitro.
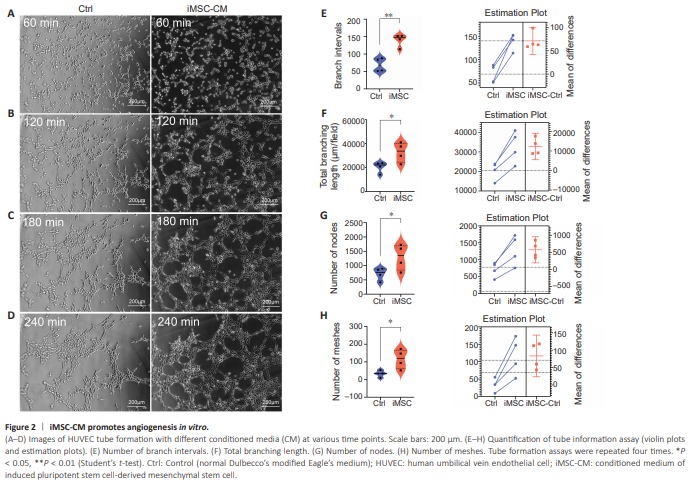
Tube formation assays were employed to investigate the angiogenic potential of iMSC-CM/every 4 hours, HUVECs migrated and formed tubular structures (Figure 2A–D). The iMSC-CM group displayed significantly higher branch intervals, total branching length, number of nodes, and number of meshes conpared with the control group (Figure 2E–H), indicating that iMSCs secreted pro-angiogenesis cytokines and promoted neovascularization.
Figure 7 | Effect of co-graft of ANA and iMSCs on regenerated myelin in rats with sciatic nerve injury after 12 weeks.
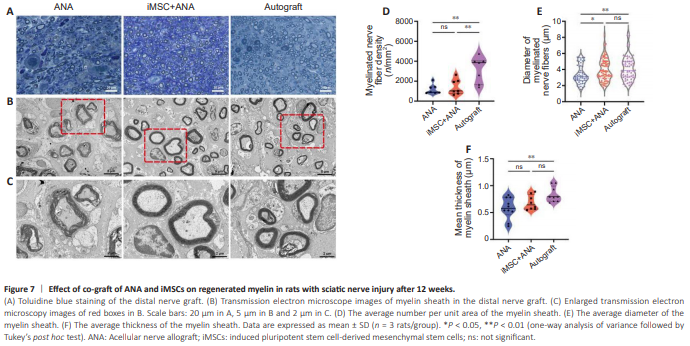
Toluidine blue staining of transverse semi-thin sections of the distal nerve stumps in different groups revealed varying degrees of axonal regeneration. In the iMSC + ANA and Autograft groups, myelinated fibers appeared densely packed and evenly arranged, surrounded by a well-formed myelin sheath. Both groups exhibited similar numbers and roughly equivalent diameters of myelinated nerve fibers (Figure 7A). Electron microscopy further illustrated that the ANA group displayed sparse myelin fiber layers with a loose arrangement, while the iMSC + ANA and Autograft groups exhibited dense myelination (Figure 7B and C). The density of regenerated myelinated nerve fibers, the average diameter of the myelin sheath, and the average thickness of the myelin sheath followed the order of Autograft, iMSC + ANA, and ANA groups (Figure 7D–F). A significant difference in myelin sheath thickness was noted between the Autograft and ANA groups (P = 0.0072), while no significance was observed between the iMSC + ANA and ANA groups (Figure 7D). The diameter of myelinated nerve fibers in the iMSC + ANA group (3.947 ± 1.379) was significantly smaller than that in the Autograft (P = 0.7426) and ANA groups (Figure 7E). No statistically significant difference in the density of myelinated nerve fibers between the iMSC + ANA and ANA groups (P = 0.9455; Figure 7F). Immunofluorescence staining and electron microscopy results collectively demonstrated that iMSCs and ANA collaboratively enhanced neurofilament development and myelination in nerve regeneration.