周围神经损伤
-
Figure 1 | hfNCSC-sEVs are taken up by PCs in vitro and enhance their proliferation and migration.
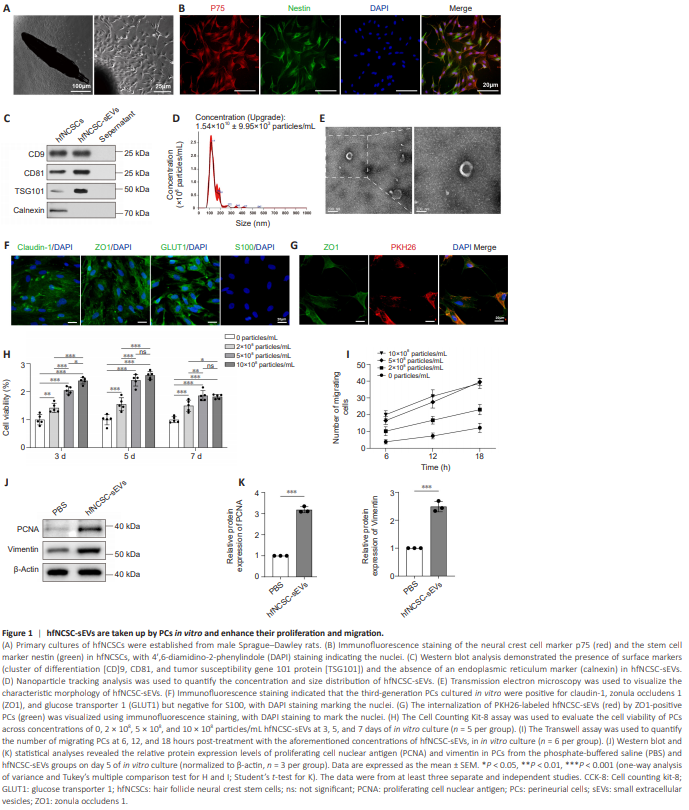
To obtain hfNCSCs, rat hair follicle bulges were cultured using the tissue explant method. By day 4 post-explantation, hfNCSCs started to emerge from the tissue, and primary hfNCSCs were successfully isolated by day 7 (Figure 1A). Immunofluorescence staining demonstrated the strong expression of the neural crest cell marker p75 and the stem cell marker nestin in hfNCSCs following four purification passages (Figure 1B). Supernatant from the hfNCSC culture medium was collected, and hfNCSC-sEVs were subsequently isolated and purified. Western blot analysis confirmed the presence of the surface markers CD9, CD81, and TSG101 in hfNCSC-sEVs; however, the endoplasmic reticulum marker calnexin was absent (Figure 1C). Nanoparticle tracking analysis revealed that the average particle size of hfNCSC-sEVs was approximately 117 nm, with a concentration of about 1.54 × 10¹⁰ particles/mL (Figure 1D). TEM demonstrated that hfNCSC-sEVs exhibited a round or oval cup-like vesicle structure (Figure 1E). Together, these results suggest that hfNCSC-sEVs were obtained at an appropriate concentration. Furthermore, immunofluorescence staining indicated that the specific markers claudin-1, ZO1, and GLUT1 were highly expressed in cultured and purified PCs, whereas the Schwann cell marker S100 was not detected (Figure 1F). Additionally, immunofluorescence staining revealed the presence of PKH26-labeled hfNCSC-sEVs within PCs (Figure 1G), indicating that PCs can take up hfNCSCsEVs in vitro. Initially, the effects of hfNCSC-sEVs on the proliferative and migratory capabilities of PCs were evaluated in vitro. The CCK-8 assay revealed that, compared with the control group (0 particles/mL), the cell viability of PCs cultured with varying concentrations of hfNCSC-sEVs (2 × 10⁸ , 5 × 10⁸ , and 10 × 108 particles/mL) significantly increased on days 3, 5, and 7. The most notable increase was observed on day 5, with no significant difference identified between the groups treated with 5 × 10⁸ and 10 × 108 particles/mL (Figure 1H). Similarly, results from the Transwell assay indicated that different concentrations of hfNCSC-sEVs substantially increased the numbers of migrating PCs. Notably, the groups treated with 5 × 10⁸ particles/mL and 10 × 108 particles/mL exhibited a significant increase compared with the 2 × 10⁸ particles/mL group, and no significant difference was observed between the two higher concentration groups (Figure 1I). Consequently, a concentration of 5 × 10⁸ particles/mL was used for the experimental application of hfNCSCsEVs. Western blot analysis demonstrated that on day 5 of in vitro culture, PCNA expression levels were significantly higher in the hfNCSC-sEVs group than in the PBS group (P < 0.001). Additionally, vimentin expression levels, which positively correlate with cell migration ability, were also significantly higher (P = 0.001; Figure 1J and K). Collectively, these findings suggest that hfNCSC-sEVs effectively enhance the proliferation and migration of PCs in vitro.
Figure 2 | hfNCSC-sEVs enhance tube formation and barrier function in PCs and promote tight junction protein expression.
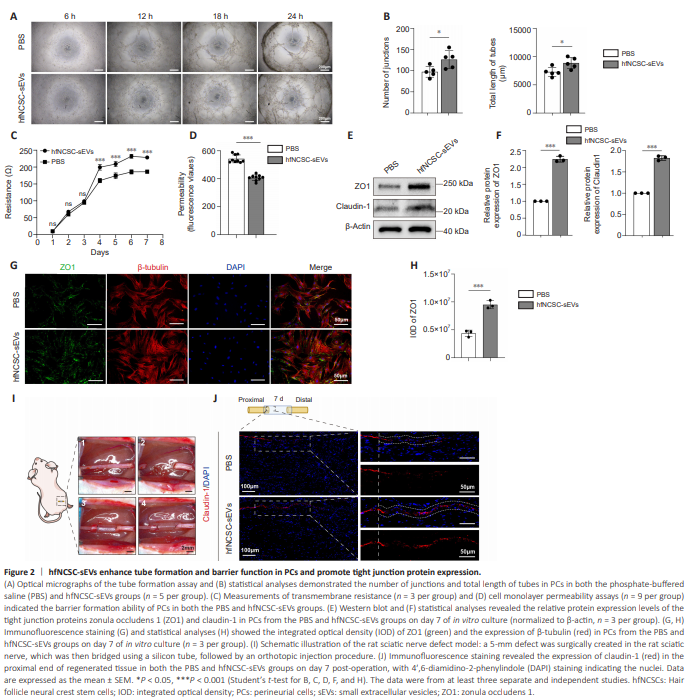
Given the endothelial cell-like properties of PCs, which are responsible for enveloping nerves to establish the perineurium, we investigated the capacity of PCs for tube formation. The tube formation assay revealed that lumina initiation occurred within 6 hours of inoculation and progressively enlarged over time. Notably, the number of junctions (P = 0.0291) and total length of tubes (P = 0.0233) of PCs in the hfNCSC-sEVs group were significantly greater than those in the PBS group at the 18-hour time point (Figure 2A and B). These findings suggest that hfNCSC-sEVs may potentiate the tubular formation of PCs in vitro. Furthermore, we assessed the establishment of tight junctions and their barrier functions during the membrane formation process of PCs. The transmembrane electrical resistance value of PCs in the hfNCSC-sEVs group was significantly higher than that in the PBS group on day 3, and this enhancement was maintained through day 7 (from day 3 to day 7: P < 0.001; Figure 2C). Higher resistance values indicate lower permeability, suggesting that the PCs exposed to hfNCSC-sEVs were more proficient at forming tight junctional barriers. On day 7 of membrane formation development, cell monolayer permeability assays revealed that fluorescence intensity in the lower chamber was significantly lower in the hfNCSC-sEVs group than in the PBS group (P < 0.001; Figure 2D). This finding indicates that PCs in the hfNCSC-sEVs group exhibit reduced permeability and a stronger barrier formation capacity. Tight junction proteins—specifically, claudin-1 and ZO1 in PCs—are essential for establishing the blood–nerve barrier (Lux et al., 2019). Western blot analysis demonstrated that the protein expression levels of ZO1 (P < 0.001) and claudin-1 (P < 0.001) were significantly higher in the hfNCSCsEVs group than in the PBS group on day 7 of in vitro culture (Figure 2E and F). Furthermore, immunofluorescence staining revealed that the integrated optical density for ZO1 was markedly higher in the hfNCSCsEVs group than in the PBS group (P < 0.001; Figure 2G and H). Together, these findings suggest that hfNCSC-sEVs enhance tight junction protein expression in PCs and improve the capacity of PCs for tube formation and barrier functionality in vitro. Claudin-1 is specifically expressed in the PCs of peripheral nerves (Reinhold et al., 2018; Ben-Kraiem et al., 2021). On day 7 following the bridging of a 5-mm defect in the sciatic nerve of rats (Figure 2I), immunofluorescence staining at the proximal end of the regenerating tissue exhibited a continuous and organized expression pattern of claudin-1. Regenerated PCs at the nerve stumps gradually formed tight junctions between cells during the processes of proliferation and migration, with claudin-1 expression appearing intermittent and scattered. Compared with the PBS group, the hfNCSC-sEVs group exhibited a broader distribution of claudin-1 expression in regenerated tissue; this was accompanied by a notable increase in claudin-1 expression intensity (Figure 2J). These results indicate that hfNCSC-sEVs can promote claudin-1 expression in PCs in vivo.
Figure 3 | hfNCSC-sEVs facilitate nerve tissue regeneration and repair following a sciatic nerve defect.
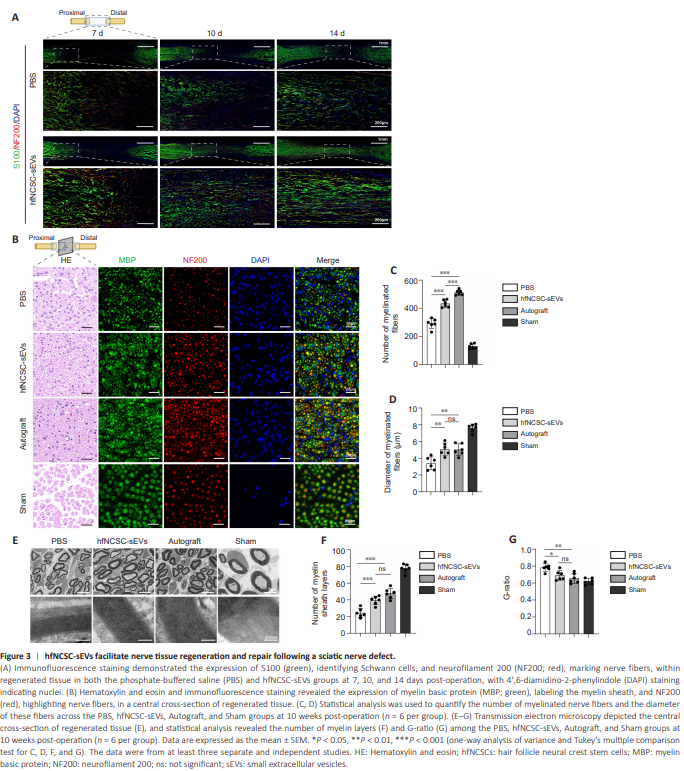
The extent of Schwann cell migration and nerve fiber regeneration in the hfNCSC-sEVs group was significantly greater than that observed in the PBS group at equivalent time intervals (Figure 3A). Subsequently, we assessed the influence of hfNCSC-sEVs on the later stages of nerve repair. Excluding the Sham group, the Autograft group exhibited the highest quantity of myelinated nerve fibers encased in MBP-positive myelin sheaths, followed by the hfNCSC-sEVs group and then the PBS group, which demonstrated the lowest number (Figure 3B–D). TEM examinations at corresponding sites revealed no significant differences in the diameters of myelinated nerve fibers or the numbers of myelin sheath layers between the Autograft and hfNCSC-sEVs groups; however, both groups significantly surpassed the PBS group for the diameter of myelinated nerve fibers (PBS vs. hfNCSC-sEVs: P = 0.0019, PBS vs. Autograft: P = 0.0026) and for the number of myelin sheath layers (PBS vs. hfNCSC-sEVs: P < 0.001, PBS vs. Autograft: P < 0.001; Figure 3E and F). G-ratio analysis confirmed no significant difference in myelin regeneration between the hfNCSC-sEVs and Autograft groups, although the hfNCSC-sEVs group yielded notably superior results compared with the PBS group (P = 0.0215; Figure 3G). Collectively, these findings indicate that hfNCSC-sEVs effectively promote nerve fiber regeneration, Schwann cell migration, and myelin formation following sciatic nerve injury in rats.
Figure 6 | miR-21-5p in hfNCSC-sEVs augments cell proliferation and migration by enhancing HAS2 expression in PCs.
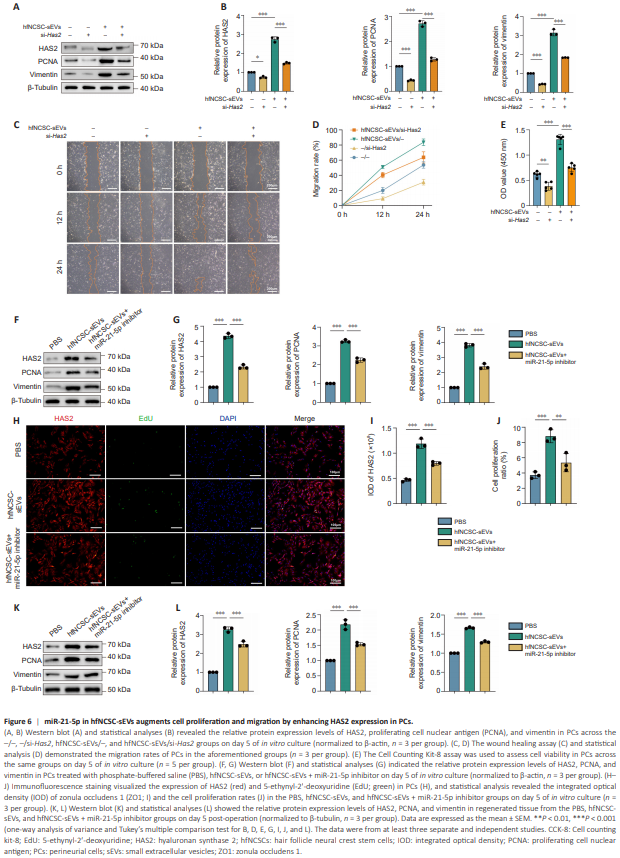
To examine the hypothesis that hfNCSC-sEVs enhance PC proliferation and migration through HAS2 upregulation, we used siRNA targeting Has2 (si-Has2) to decrease HAS2 levels in PCs. By day 5 of in vitro culture, the hfNCSC-sEVs group exhibited significantly higher HAS2 (P < 0.001), PCNA (P < 0.001), and vimentin (P < 0.001) expression than the control group, which lacked both hfNCSC-sEVs and si-Has2 (–/– group). Compared with the –/– and hfNCSCsEVs/– groups, HAS2 expression was significantly downregulated in the –/si-Has2 and hfNCSC-sEVs/si-Has2 groups following transfection with si-Has2 (–/– vs. –/si-Has2: P = 0.0134, hfNCSC-sEVs/– vs. hfNCSC-sEVs/si-Has2: P < 0.001). Furthermore, the PCNA (–/– vs. –/si-Has2: P < 0.001, hfNCSC-sEVs/– vs. hfNCSC-sEVs/si-Has2: P < 0.001) and vimentin (–/– vs. –/si-Has2: P < 0.001, hfNCSC-sEVs/– vs. hfNCSC-sEVs/si-Has2: P < 0.001) expression levels in these two groups were also significantly reduced (Figure 6A and B). In the wound healing and CCK-8 cell proliferation assays, suppressing HAS2 expression also markedly diminished the enhancing effects of hfNCSC-sEVs on PC proliferation and migration (Figure 6C–E). Collectively, these results suggest that hfNCSCsEVs upregulate HAS2 expression in PCs, thereby facilitating their proliferation and migration.
However, this stimulatory effect was partially diminished in the hfNCSC-sEVs + miR-21-5p inhibitor group compared with the hfNCSC-sEVs group (Figure 6F and G). Immunofluorescence staining further demonstrated that the integrated optical density value of HAS2 (P < 0.001) and the proliferation ratio of PCs (P < 0.001) were markedly higher in the hfNCSC-sEVs group than in the PBS group; these effects were correspondingly reduced upon miR-21-5p inhibition (Figure 6H–J). Additionally, the protein expression levels of HAS2, PCNA, and vimentin in regenerated tissue decreased on day 5 post-operation when miR-21-5p was inhibited in the hfNCSC-sEVs group (Figure 6K and L).
Figure 7 | miR-21-5p in hfNCSC-sEVs enhances tight junction protein expression in PCs.
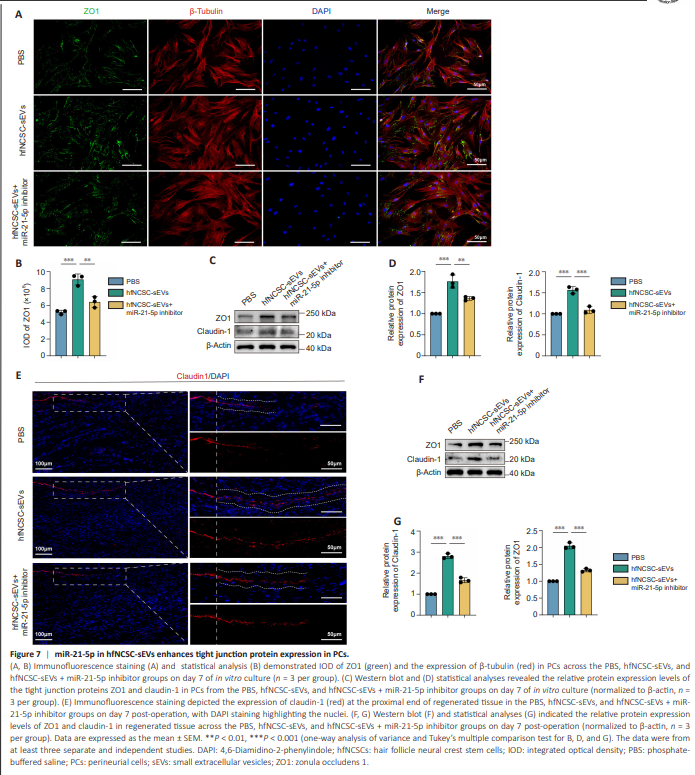
To further investigate the role of miR-21-5p in hfNCSC-sEVs with regard to tight junction protein formation in PCs, immunofluorescence staining and western blot analysis were used. The enhancement of tight junction protein expression by hfNCSC-sEVs was attenuated in PCs in the hfNCSC-sEVs + miR-21-5p inhibitor group on day 7 (Figure 7A–D). These findings were corroborated by immunofluorescence staining and western blot analysis of regenerated tissue on day 7 post-surgery (Figure 7E–G).