脑损伤
-
Figure 1|Single-cell sequencing showing the cellular composition of lateral walls of lateral ventricles (en face) in adult mice.
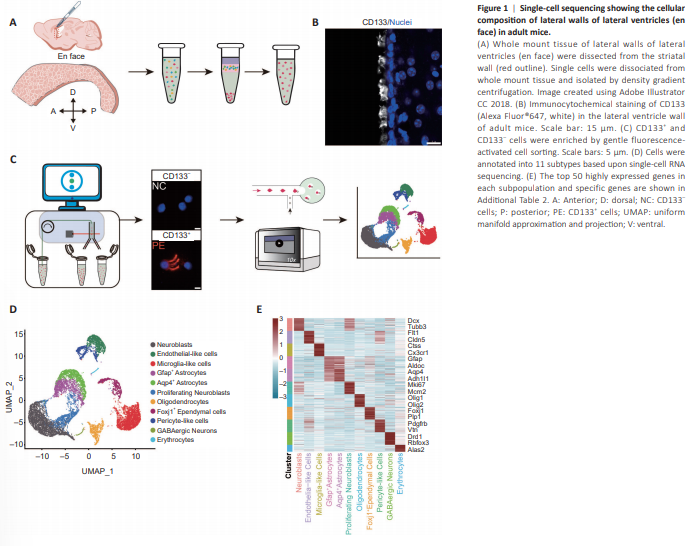
Ependymal cells comprise the single layer of cells lining the ventricular surface, and as such are in direct contact with cerebrospinal fluid (Spassky et al., 2005; Del Bigio, 2010). Neurogenic en face preparations are whole tissue mounts of lateral walls of lateral ventricles, containing both ependymal and sub-ependymal structures and zones. To determine the cellular composition of adult mouse en face tissue preparations, with a focus on ependymal zones, we performed scRNA-seq (Figure 1A). En face tissue from 8-weekold C57BL/6J male mice (n = 7) was dissected and dissociated into single cells. As CD133 immunoreactivity (antibody Clone No. 13A4) specifically labels ependymal multi-ciliated cells, and particularly cilia (Figure 1B and Additional Figure 1A), ependymal cells with high CD133 protein expression were enriched by soft FACS. CD133+ cells were denoted as ‘PE’ cells and CD133– cells were denoted as ‘NC’ cells (Figure 1C). High-quality scRNA-seq data were obtained from a total of 8594 cells in the NC fraction and 9017 cells in the PE fraction (Additional Figure 1B). Overall, 14,658 cells (7231 CD133+ cells and 7427 CD133– cells) were obtained for subsequent bioinformatics analyses. In total, 11 cell clusters were annotated according to their specific gene signatures, including neuroblasts, proliferating neuroblasts, Gfap+ astrocytes, aquaporin 4 (Aqp4) + astrocytes, oligodendrocytes, microglia-like cells, forkhead box protein J1 (Foxj1) + ependymal cells, endothelial-like cells, pericyte-like cells, and erythrocytes (Figure 1D). The top 50 genes highly expressed in each cell subtype were relatively specific (Llorens-Bobadilla et al., 2015; Luo et al., 2015; Basak et al., 2018; Figure 1E, Additional Figure 1C, and Additional Table 2).
Figure 4 | Whole-mount immunocytochemical staining of en face preparations showing the cellular composition of ependyma.
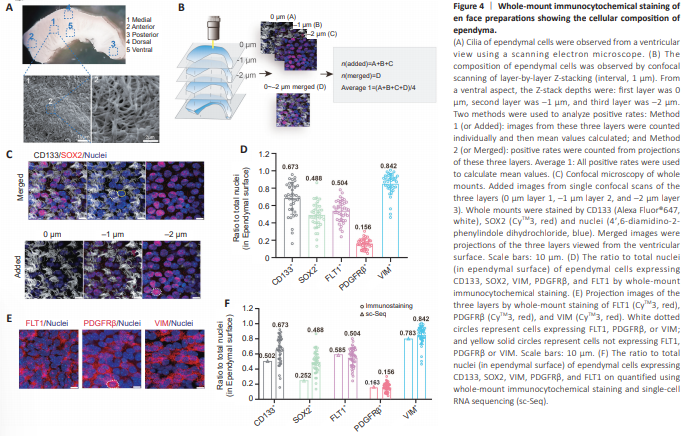
Because scRNA-seq data contain no spatial information, analysis of EPE cells was based on prior knowledge of the ependyma. To validate our scRNA-seqbased ependymal cell subtype composition analysis, we next performed immunocytochemical staining using en face preparations. We examined the five markers, Prom1 (CD133), Sox2, Flt1, Pdgfrb, and Vim, with their corresponding widely used antibodies (Coskun et al., 2008; Morrow et al., 2020; Delgado et al., 2021; Zhao et al., 2022). Electron microscopy showed that the lateral wall appeared rugged, rather than a flat and smooth structure (Figure 4A, ventricular view). Cilia of ependymal cells were distributed in clusters across the entire surface of the lateral wall (en face ependyma). Immunocytochemical staining detailing the cilia and outermost ependymal cells were captured in z-stacked images by laser confocal microscope (1 μm intervals) (Figure 4B). Using the “Added method,” most CD133+ cilia were detected in 0 and –1 μm layers, while most SOX2 proteins appeared in –1 and –2 μm layers. Nuclei exhibited clear morphology in all three layers (Figure 4C). Protein expression at different depths from the surface were detected more accurately using the “Added image method,” while protein expression of the ependyma was observed more holistically using the “Merged image method” (Figure 4C). Immunocytochemical staining with five well-characterized primary antibodies (against CD133, SOX2, FLT1, PDGFRβ, and VIM) was used to systematically investigate ependymal cell subtype compositions (Figure 4D and E). To achieve more accurate marker positive rates, each marker positive rate was first calculated using both the Added and Merged methods (Additional Figure 7). Both Average 1 and Average 2 methods were used to obtain averaged rates of marker-positive subtypes of cells (Additional Figure 7A), which were found to be similar. Because values from the Average 1 method correlated better with the positive rates determined by single-cell transcriptome sequencing, this method was selected for the remaining analyses (Figure 4D and Additional Figure 7). Accordingly, 67% of all en face ependymal cells were CD133+ , 49% were SOX2+ , 50% were FLT1+ , 16% were PDGFRβ+ , and 84% were VIM+ (Figure 4D). Immunocytochemical staining results were further compared with sc-RNA sequencing results. Both methods were highly correlated, but not identical (Figure 4F). For example, immunocytochemical staining of CD133, SOX2, and VIM protein marker positive rates were higher compared with those obtained from scRNA-seq data (Figure 4F), yet the opposite was found for FLT1. It is worth noting that immunocytochemical staining represents measurements based on protein levels, while scRNA-seq represents mRNA levels. Therefore, these two parameters do not necessarily have to be similar. Moreover, the lower mRNA capture rate associated with the 10× Chromium scRNAseq platform may lead to false negatives. Conversely, immunocytochemical staining is affected by antibody quality and detection thresholds. Because immunocytochemical staining contains spatial information, as well as protein expression levels, it is considered a more accurate method for ependymal cell subtype composition analyses. Moreover, scRNA-seq provided superior, unbiased overall guidance on comprehensive immunocytochemical staining analyses.
Figure 5 | Co-expression ratio of ependymal cell markers by immunocytochemical staining.
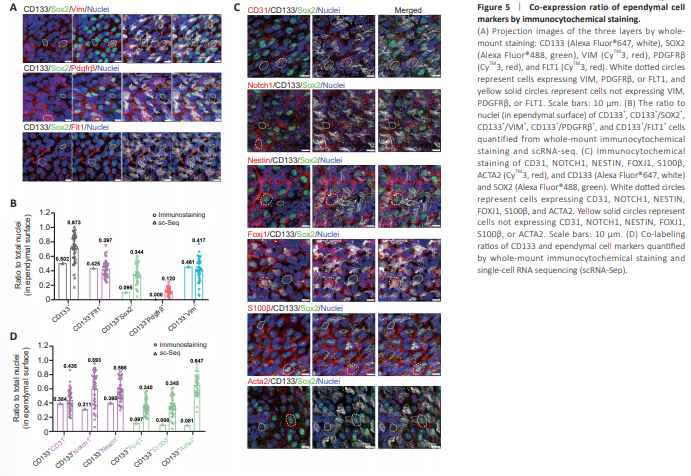
Immunocytochemical staining with single markers suggested the presence of co-expression, as the percentages summed up to > 100%. Co-expression of these five markers was also apparent from scRNA-seq data. Thus, double and triple labeling was performed in immunocytochemical staining analyses. CD133 was still used as the first partition marker, and cells were costained for CD133 and SOX2, or FLT1, or PDGFRβ, or VIM (Figure 5A, B and Additional Figure 8A). The population of CD133 and FLT1 double-positive cells comprised 40% of all cells on the en face ependymal surface. The CD133+ /SOX2+ population occupied 34%, CD133+ /PDGFRβ+ population 12%, and CD133+ /VIM+ population 42% (Figure 5B). Compared with the scRNAseq data, the rankings on abundance of double positive cell populations were largely the same, while immuno co-labeling for SOX2/CD133 double positive and PDGFRβ/CD133 double positive populations tended to produce higher cell content than sc-RNA seq results. As already mentioned, scRNA-seq results might have false negatives, which could explain this discrepancy. In addition to these five representative markers, which labeled endotheliallike (FLT1+ ), Foxj1+ , and pericyte-like CD133+ and CD133– ependymal populations, other markers co-expressed in endothelial-like ependymal cells were investigated (CD31, NESTIN, and NOTCH1), as well as those coexpressed in Foxj1+ -like cells (FOXJ1, S100β, and ACTA2) (Figure 5C, D and Additional Figure 8B).