视神经损伤
-
Figure 1|Experimental protocol, structure of luteolin, and dose-dependent tests.
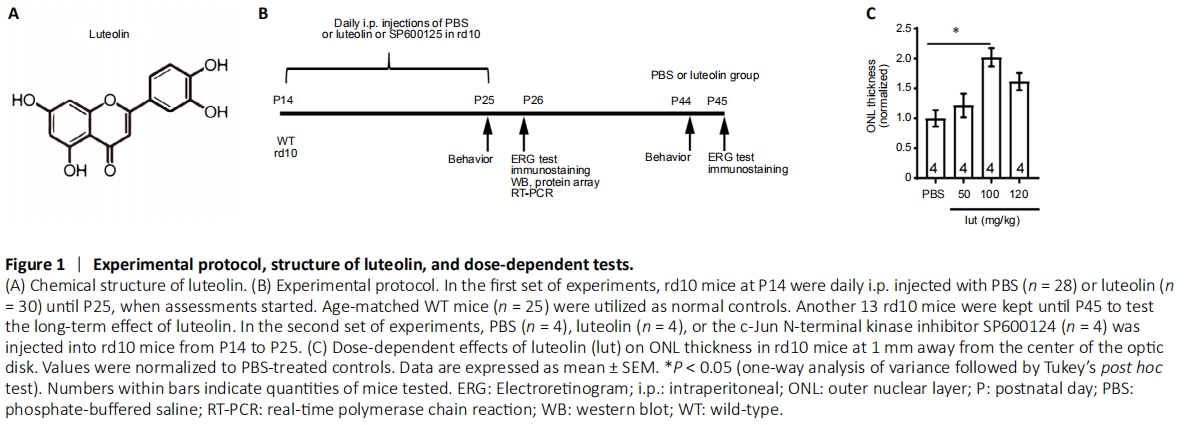
Luteolin (3?,4?,5,7-tetrahydroxyflavone; Figure 1A) is an important flavonoid present in numerous plants, such as vegetables, fruits, and medicinal herbs. With its capacity to scavenge both oxygen and nitrogen species, luteolin exerts many biological effects including anti-oxidation (Williams et al., 2004), anti-inflammation (Chen et al., 2007), and anti-angiogenesis (Park et al., 2012). In the eye, luteolin was shown to be neuroprotective following oxidative injury of retinal ganglion cells (Maher and Hanneken, 2005) and retinal pigment epithelial cells (Hanneken et al., 2006; Hytti et al., 2015). In an in vitro experiment, luteolin was found to inhibit microglial neurotoxicity (Dirscherl et al., 2010). These properties of luteolin indicate that it may be useful for treating other retinal diseases.
Animals were randomly assigned to five groups: WT (n = 46), PBS (rd10 + PBS; n = 58), luteolin (rd10 + luteolin; n = 64), dimethyl sulfoxide (rd10 + dimethyl sulfoxide; n = 4), and SP600125 (rd10 + SP600125; n = 4). Concentrations of luteolin ranging from 50–120 mg/kg body weight (Hendriks et al., 2004; Ziyan et al., 2007; Liu et al., 2013) or equal volumes of PBS were i.p. injected daily into rd10 littermates starting from P14 (after eye opening) until P25 (when photoreceptor apoptosis peaks) (Gargini et al., 2007; Barhoum et al., 2008). At P25, rd10 mice were examined for their visual behaviors using the black and white transition, and optomotor tests. Thereafter, mice were dark-adapted overnight and an electroretinogram (ERG) recording was performed the next day (P26), followed by immediate sacrifice and tissue collection. Retinas were subjected to either immunochemical staining or total RNA and protein extraction for subsequent real-time quantitative polymerase chain reaction (RT-qPCR) and western blot assays, respectively. To examine the long-term impacts of treatments, several assessments were performed at P45, a point at which most rods have degenerated. Age-matched WT mice were simultaneously tested along with normal controls. The detailed protocol is illustrated in Figure 1B.
We next explored the optimal dosage of luteolin (ranging from 50 to 120 mg/kg body weight) following a daily single i.p. injection from P14 to P25. As a simple index of rod survival, we used thickness of the ONL at 1.0–1.3 mm away from the optic nerve center (Wang et al., 2014). Our results show that following injection of 100 mg/kg luteolin, average thickness of the ONL was 2.0 ± 0.1-fold greater than that of the PBS group. Moreover, it was greater than that of the groups receiving 50 mg/kg (1.2 ± 0.2-fold) or 120 mg/kg (1.6 ± 0.1-fold) luteolin (Figure 1C). Therefore, for the remaining experiments, we applied luteolin at a dosage of 100 mg/kg.
Figure 2|Luteolin (lut) improves visual behaviors in rd10 mice.

To investigate whether luteolin enhanced the visual function of rd10 mice, we tested their light perception using the dark-light transition, and their visual acuity using optomotor responses. The dark-light transition box (Figure 2A) can evaluate the perception of luminance by a mouse’s tendency to stay in darkness, as WT mice with normal vision tend to spend most of their time in the dark chamber. At P26, the time that PBS-treated rd10 mice spent in darkness was substantially reduced (43.0 ± 2.7% of the total duration, n = 12) compared with WT mice (65.2 ± 2.3%, n = 10, P < 0.001), indicating an impaired capability to detect luminance. Following luteolin treatment, rd10 mice stayed substantially longer in darkness (64.3 ± 2.7%, n = 14, P < 0.001, vs. PBS-treated controls; Figure 2B).
Optomotor responses indicate the visual acuity of a mouse by exposing it to moving gratings of increasing spatial frequencies (Figure 2C) (Prusky et al., 2004). The higher the spatial frequency (i.e. the finer the grating) that an animal can respond to, the greater its visual acuity. Compared with WT mice, which detected 0.36 ± 0.01 cycles/degree (n = 7), the threshold of rd10 mice was much lower (0.18 ± 0.02 cycles/degree, n = 11, P < 0.001). Luteolin treatment significantly improved visual acuity according to this index, which increased to 0.30 ± 0.01 cycles/degree (n = 11, P < 0.001, vs. PBS-treated group; Figure 2D). However, rd10 mice tested at P45 hardly showed any improvement (Additional Figure 1A). Thus, amelioration of visual behaviors in rd10 mice by luteolin seemed to be restricted to an early stage of degeneration.
Figure 3|Luteolin (lut) improves light responses in the retinas of rd10 mice.
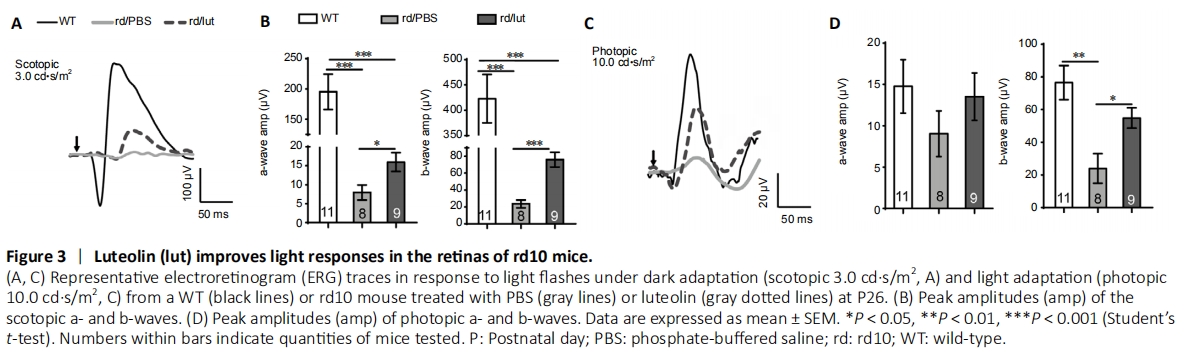
To examine the impact of luteolin on retinal physiology, ERG recordings were performed at P26. In WT mice, retinal neurons responded well to light flashes under both dark-adapted (black lines in Figure 3A) and light-adapted (photopic) conditions (Figure 3C). Owing to photoreceptor degeneration, light responses in rd10 mice were dramatically decreased (gray lines in Figure 3), but could be partly recovered by luteolin (gray dotted lines in Figure 3). Under dark-adapted conditions, the average amplitudes of a- and b-waves at 3.0 cd?s/m2 in PBS-treated rd10 mice (n = 8) were significantly reduced compared with those of WT controls (P < 0.001, n = 11). Following luteolin treatment, a- and b-wave amplitudes were both significantly increased [2-fold for a-wave (P < 0.05) and 3.2-fold for b-wave (P < 0.001), n = 9; Figure 3B)]. At lower flash intensities of 0.01 and 0.1 cd?s/m2, luteolin tended to increase amplitudes of both a- and b-waves, but there was no significant difference compared with the PBS-treated group (Additional Figure 2).
Under photopic conditions, the a-wave amplitude slightly declined, which was partially recovered by luteolin (Figure 3D). The photopic b-wave amplitude decreased significantly from 76.5 ± 10.4 μV in WT controls to 23.9 ± 9.0 μV in PBS-treated rd10 mice (P < 0.01). Luteolin treatment markedly increased the b-wave amplitude to 54.8 ± 6.2 μV (P < 0.05, vs. PBS-treated group; Figure 3D). Hence, our ERG results indicate that luteolin preserved both rod- and cone-mediated light responses in the rd10 retina.
Figure 4|Luteolin increases the survival of photoreceptors in rd10 mice.

Improvements in scotopic and photopic ERG after luteolin treatment suggest that photoreceptor and/or bipolar cell degeneration was slowed down. Thus, the survival of photoreceptors was examined at different eccentricities from the central to peripheral regions. Typical examples of retinal slices from the middle region of each group are shown in Figure 4A. By P25, the ONL thickness in PBS-treated rd10 retinas became considerably thinner at all regions (P < 0.001, vs. WT counterparts). In the luteolin-treated group, more layers of photoreceptor somas remained and the ONL was significantly thicker (1.2–1.5-fold) compared with the PBS-treated group (Figure 4B; P < 0.05 at 800 μm and 1200 μm from the center). At P45, when rod degeneration enters the late stage, only a single tier of somas remained in the ONL of PBS-treated rd10 retinas, and luteolin had little effect (Additional Figure 1D).
Figure 5|Luteolin (lut) preserves the morphological structure of photoreceptors and bipolar cells in rd10 mice.

We next studied the structure of cone and rod photoreceptors by immunostaining. In WT retina, staining for rhodopsin at P25 was very strong in the outer segments, but weak in the inner segments and somas. In PBS-treated rd10 retina, staining was predominantly restricted to the outer segments that had become much shorter (Figure 5A, left and middle panel). After luteolin treatment, the outer segment layer was thicker, indicating longer outer segments (7.3 ± 2.2 μm vs. 3.4 ± 0.7 μm in PBS group, P < 0.01; Figure 5B). Similarly, staining for red/green opsin in WT retina revealed clear long cone outer segments (14.4 ± 0.6 μm; Figure 5C), which were significantly shortened in PBS-treated rd10 mice (2.2 ± 0.1 μm) but dramatically restored with luteolin administration (6.4 ± 0.8 μm, P < 0.01; Figure 5D).
To evaluate protection of retinal structures by luteolin, we assessed the structures of rod bipolar cells with an antibody against protein kinase C-α (Figure 5E). As the dendritic trees of bipolar cells shrink upon the loss of their synaptic input, measuring dendritic length can indicate the ability of these cells to collect information. In the rd10 retina, dendritic length was 48% of WT controls (Figure 5E). The average length of these dendrites was significantly increased from 5.4 ± 0.2 μm in the PBS-treated group to 8.2 ± 0.3 μm (or 72% of WT controls) in the luteolin-treated group (P < 0.01; Figure 5F). Collectively, our results indicate that luteolin had a protective effect on the retinal structure of rd10 mice.
Figure 6|Luteolin (lut) inhibites apoptosis and oxidative stress in the retinas of rd10 mice.
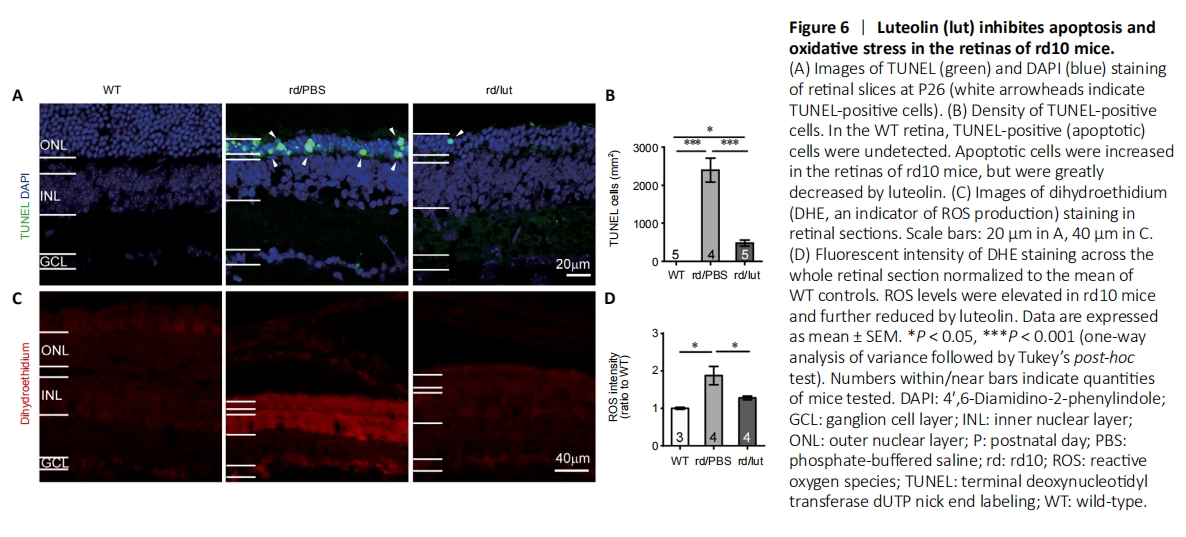
A TUNEL assay was utilized to identify apoptotic photoreceptors (Figure 6A). In WT retina, no TUNEL-positive cells were observed (n = 5). Consistent with our prior report (Zhang et al., 2017), numerous TUNEL-positive cells appeared in the ONL of rd10 retinas (2396 ± 311 cells/mm2, n = 4, P < 0.001, vs. WT controls), and treatment with luteolin significantly reduced this number to 478 ± 79 cells/mm2 (n = 5, P < 0.001 vs. PBS; Figure 6B). Given that TUNEL-positive cells exclusively represent the apoptotic population (Gavrieli et al., 1992), our results suggest that luteolin attenuated photoreceptor apoptosis in rd10 mice.
To examine whether the aforementioned impact on apoptosis was mediated by modulation of ROS production, we stained retinal sections with the ROS indicator DHE (He et al., 2013). As shown in Figure 6C, hardly any DHE was observed in WT retina, but its staining intensity was increased by 1.8 ± 0.2-fold in PBS-treated rd10 retina (P < 0.05), indicating an overt increase in ROS production. Luteolin significantly reduced the increase in DHE fluorescent intensity to 1.2 ± 0.04-fold (P < 0.05, vs. PBS-treated group; Figure 6D), suggesting that it inhibited ROS production in the rd10 retina.
Figure 7|Luteolin (lut) inhibites reactive gliosis in the retinas of rd10 mice.

In accordance with previous literature, Iba1-positive cells were mainly present in the inner plexiform layer and inner retina with branch ramifications (Genové et al., 2014) (Figure 7A, left panel). In PBS-treated rd10 mice, microglia were distributed across all layers of the retina at P26, particularly in the outer layers. Many microglia displayed reactive morphologies, i.e. an amoeboid shape with large somas (Figure 7A, middle panel). Luteolin treatment reduced numbers of reactive microglia in the outer retina (Figure 7A, right panel). To quantify this, we measured the area of Iba-1 positive staining in each section. The Iba-1 positive area of the PBS-treated group increased to 4.8-fold that of WT controls, and luteolin reduced this value to 3.4-fold (P < 0.01, vs. PBS group; Figure 7C).
Unlike in the WT retina, whereby GFAP staining in Müller cells was limited to their end feet in the nerve fiber layer (Figure 7B, left panel), vertically running processes of Müller cells were intensely stained up to their termination in the outer limiting membrane of degenerating rd10 retinas (Figure 7B, middle panel). This staining was significantly reduced by luteolin treatment given that the stained processes typically did not cross the ONL (Figure 7B, right panel).
To quantify GFAP expression, lengths of GFAP-stained Müller cell processes were measured and their quantities in each section were counted. As shown in Figure 7D, the mean length of Müller cell processes was 7.9 ± 0.4 μm (n = 5) in WT controls and significantly increased to 107.6 ± 2.3 μm in PBS-treated rd10 mice (n = 5, P < 0.001; Figure 7D). Treatment with luteolin significantly reduced this parameter to 90.0 ± 2.3 μm (n = 5, P < 0.001, vs. PBS-treated group). Luteolin further lowered the number of GFAP-positive processes from 37.8 ± 1.2 per image in the PBS-treated rd10 group to 30.6 ± 1.0 per image (P < 0.001; Figure 7E). Hence, luteolin alleviated gliosis of Müller cells in rd10 retinas.
Figure 8|Effects of luteolin (lut) on mRNA expression of inflammation-related cytokines in retinas of rd10 mice (rd).

As reactive gliosis is a major indicator of inflammation in the retina (Zhang et al., 2017), we next examined retinal expression of inflammation-related molecules by RT-qPCR. These molecules included: (i) pro-inflammatory cytokines interleukin-1 beta (Il-1β) and tumor necrosis factor-alpha (Tnf-α); (ii) anti-inflammatory cytokines transforming growth factor-beta (Tgf-β), arginase 1 (Arg-1), interleukin 6 (Il-6), interleukin 10 (Il-10), and nitric oxide synthase-2 (Nos-2); and (iii) chemoattractant cytokines C-C motif chemokine ligand 2 (Ccl-2), C-C motif chemokine ligand 3 (Ccl-3), and CXC motif chemokine ligand-10 (Cxcl-10). As expected, overall expression of the pro-inflammatory and chemoattractant cytokines listed above was greatly upregulated in the retinas of rd10 mice (Figure 8A and B). In contrast, expression of anti-inflammatory cytokines was substantially downregulated (Figure 8C). Treatment with luteolin reversed these changes by decreasing mRNA levels of pro-inflammatory and chemoattractant cytokines, while increasing those of anti-inflammatory cytokines. Specifically, compared with the PBS group, decreases of pro-inflammatory Il-1β and Tnf-α were highly significant (P < 0.001), and that of chemoattractants was either highly significant (P < 0.01 for Ccl-2) or significant (P < 0.05 for Ccl-3 and Cxcl-10). Notably, Tgf-β expression in luteolin-treated retinas was restored to a normal level and highly significant compared with PBS-injected mice (P < 0.001).
Figure 9|Luteolin inhibited (lut) the JNK pathway in the retinas of rd10 mice (rd).

The MAPK family reportedly responds to inflammation (Yao et al., 2017). For example, phosphorylation of JNK is closely associated with the overproduction of inflammatory mediators, as well as the occurrence of inflammation (Wang et al., 2020). Here, we used western blotting and protein arrays to identify potential signaling pathways involved in luteolin-mediated protection against retinal degeneration. As shown in Figure 9A, there was hardly any change in the p-ERK to ERK ratio in all three conditions. In contrast, although there was no significant difference between the ratio of p-JNK/JNK in WT and rd10 retinas, this ratio was greatly reduced in luteolin-treated mice (Figure 9B), suggesting that luteolin may play an inhibitory role in JNK signaling. To further unravel the underlying mechanism, we applied a protein array and screened the expression of targets involved in multiple pathways potentially regulated by luteolin, including AKT, mammalian target of rapamycin (mTOR), adenosine 5′-monophosphate-activated protein kinase (AMPK), phosphatase and tensin homologue deleted on chromosome ten (PTEN), ERK, and p38 mitogen-activated protein kinase (p38MAPK). However, none of these pathways seemed responsible for the neuroprotection elicited by luteolin, as changes in the phosphorylation of key targets following luteolin treatment were insignificant compared with PBS-treated rd10 counterparts (Figure 9C).
Figure 10|The JNK inhibitor SP600125 preserved the retinal morphology of rd10 mice (rd) .
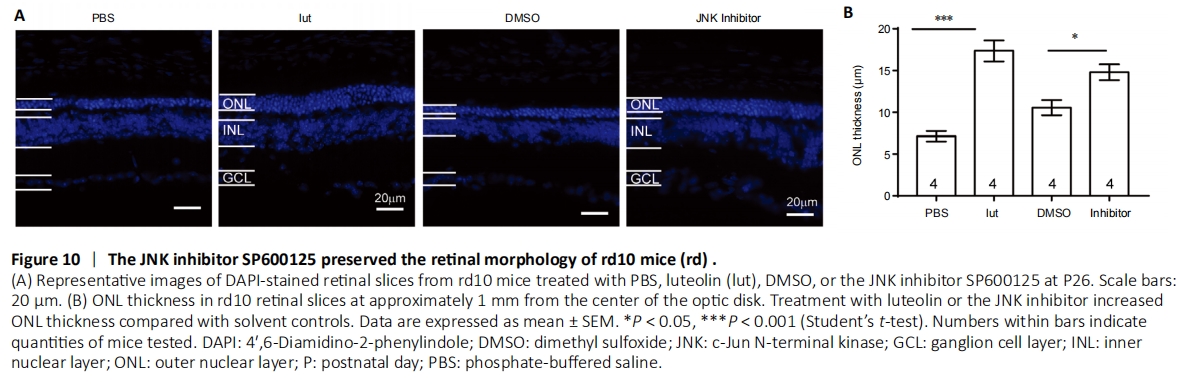
To substantiate the regulatory role of the JNK pathway in luteolin-elicited neuroprotection, the JNK antagonist SP600125 was injected into rd10 mice using the same protocol described above. As shown in Figure 10, injection of luteolin or SP600125 alone significantly increased the ONL thickness compared with their respective solvent controls. These results indicate that in RP mice, inhibiting the JNK pathway contributes to the delay of photoreceptor degeneration.