脑损伤
-
Figure 3| H19 directly interacts with miR-325-3p in iPSCs and iNSCs.
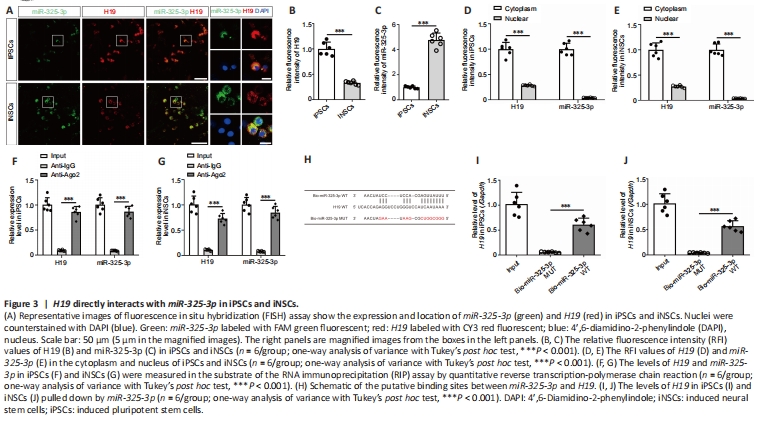
To examine the potential interaction of miR-325-3p and H19 in cells, we performed FISH assay to determine the subcellular localization of H19 and miR-325-3p in iPSCs and iNSCs. The results demonstrated colocalization of H19 and miR-325-3p in iPSCs and iNSCs (Figure 3A). The relative fluorescence intensity (RFI) values of H19 in iPSCs were substantially higher than those in iNSCs (P < 0.0001; Figure 3B). In contrast, the RFI values of miR-325-3p in iPSCs were markedly lower than those in iNSCs (P < 0.0001; Figure 3C). The RFI values of H19 and miR-325-3p in the cytoplasmic fraction of iPSCs (H19: P < 0.0001; miR-325-3p: P < 0.0001) and iNSCs (H19: P < 0.0001; miR-325-3p: P < 0.0001) were significantly higher than those in the nuclear fraction (Figure 3D and E). To confirm the results of the FISH assay, we performed nuclear and cytoplasmic fractionation assays and observed that H19 levels were substantially higher in the cytoplasmic fraction of iPSCs (P < 0.0001) and iNSCs (P < 0.0001) than the nuclear fractions, suggesting that H19 was mainly localized in the cytoplasmic fraction; similar results were observed for miR-325-3p (Additional Figure 5A and B).
To further elucidate the interaction between H19 and miR-325-3p, we used RIP assays and discovered that H19 and miR-325-3p were specifically enriched in Ago2 pellets of iPSC and iNSC extracts relative to the IgG control group (Figure 3F and G). Biotin-coupled miRNA pull down assay revealed that the incubation of Bio-miR-325-3p WT led to a dramatic increase in H19 enrichment in iPSCs and iNSCs compared with the Bio-miR-325-3p MUT group (Figure 3H–J).
Figure 5|Ctbp2 directly interacts with miR-325-3p in iPSCs and iNSCs.
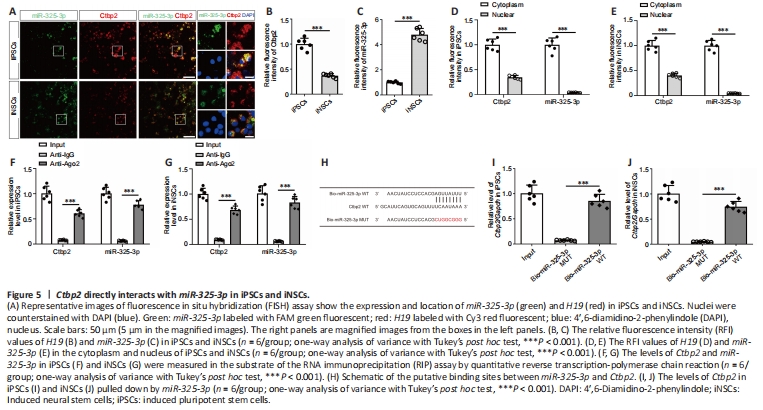
To examine the interaction of miR-325-3p and Ctbp2, we performed FISH assays to detect the subcellular localization of Ctbp2 and miR-325-3p in iPSCs and iNSCs. We found colocalization of Ctbp2 and miR-325-3p in iPSCs and iNSCs (Figure 5A). The RFI values of Ctbp2 in iPSCs were markedly higher than those in iNSCs (P < 0.0001; Figure 5B), whereas the RFI values of miR-325-3p in iPSCs were substantially lower than those in iNSCs (P < 0.0001; Figure 5C). Additionally, RFI values of Ctbp2 and miR-325-3p in the cytoplasmic fraction of iPSCs (Ctbp2: P < 0.0001; miR-325-3p: P < 0.0001) and iNSCs (Ctbp2: P < 0.0001; miR-325-3p: P < 0.0001) were significantly higher than those in the nuclear fraction (Figure 5D and E). To confirm the results of the FISH assay, we conducted nuclear and cytoplasmic fractionation assays and found that Ctbp2 levels in the cytoplasmic fraction of iPSCs (P < 0.0001) and iNSCs (P < 0.0001) were markedly higher than those in the nuclear fraction, suggesting that Ctbp2, similar to miR-325-3p, was mainly localized in the cytoplasmic fraction (Additional Figure 7A and B).
To further clarify the interaction between Ctbp2 and miR-325-3p, we performed RIP assays and found that Ctbp2 and miR-325-3p were specifically enriched in Ago2 pellets of iPSC and iNSC extracts relative to the IgG control group (Figure 5F and G). Biotin-coupled miRNA pull down assay revealed that the incubation of Bio-miR-325-3p WT led to a dramatic increase in Ctbp2 enrichment in iPSCs and iNSCs compared with the Bio-miR-325-3p MUT group (Figure 5H–J).
Figure 6|H19 functions as a sponge of miR-325-3p, which targeted Ctbp2, influencing proliferation of induced neural stem cells (iNSCs).

We conducted CCK8 assays and found that H19 inhibition reduced the proliferation of iNSCs (Figure 6A). Notably, miR-325-3p inhibitor reversed the effect of H19 inhibition (24 hours: P = 0.0026; 48 hours: P = 0.0067; 72 hours: P = 0.0022), while CtBP2 inhibition with cotransfection with shH19 and miR-325-3p inhibitor significantly reduced the proliferation of iNSCs (24 hours: P = 0.0189; 48 hours: P = 0.0034; 72 hours: P = 0.0015), suggesting that miR-325-3p and Ctbp2 exerted significant influence on the effects of H19 on iNSC proliferation. Furthermore, EdU assays showed that silencing H19 reduced the proliferation of iNSCs (P = 0.0018) and this reduction was eliminated by miR-325-3p inhibitor cotransfection (P = 0.0086; Figure 6B and C). Moreover, silencing CtBP2 in cells with shH19 and miR-325-3p inhibitor substantially decreased the proliferation of iNSCs (P = 0.0013).
We performed qRT-PCR to evaluate neurogenesis-associated mRNAs in iNSCs. H19 inhibition significantly reduced the levels of stemness- and proliferation-associated mRNAs Sox2 (P = 0.0022) and Nes (P = 0.0124), whereas it markedly increased the levels of neurogenesis-associated mRNAs Brn2 (P = 0.0100), Tubb3 (P = 0.0031) and Syp (P = 0.0078; Figure 6D). Western blot analysis revealed that Sox2 (P = 0.0026), Nestin (P = 0.0017) and CtBP2 (P = 0.0034) levels in iNSCs of the shH19 group were substantially lower than those in the control group, while TUBB3 (P = 0.0132) and SYP (P = 0.0019) levels were significantly higher in the shH19 group than in the control group (Figure 6E and F). Immunofluorescence staining showed that H19 inhibition markedly reduced the levels of Sox2+ (P = 0.0012) and CtBP2+ (P = 0.0061) iNSCs (Figure 6G and H). TUNEL assays revealed no significant differences in the number of TUNEL+ cells between the shH19 and control groups, suggesting that H19 inhibition did not lead to cell damage (Figure 6I).
Figure 7|H19 regulates the proliferation and neural differentiation of iNSCs.

We further performed double-labeling experiments. We found that H19 inhibition substantially reduced the levels of CtBP2 (P = 0.0021) in iNSCs while markedly increasing the levels of TUBB3 (P = 0.0001) and SYP (P = 0.0002) in iNSCs (Figure 7A–C). Furthermore, flow cytometry analysis demonstrated that H19 inhibition significantly decreased the levels of CtBP2 (P = 0.0047) and Nestin (P = 0.0034) in iNSCs and substantially increased the levels of NeuN (P = 0.0028), TUBB3 (P = 0.0012) and SYP (P = 0.0005) in iNSCs (Figure 7D and E). Therefore, these results revealed that H19 inhibition promoted the neural differentiation of iNSCs.
We next examined the influence of H19 inhibition on neural differentiation of iNSCs in vivo. We examined the neural differentiation of GFP-labeled iNSCs in the injured cortices of control (CHI mice receiving iNSCs transfected with scr) and shH19 (CHI mice receiving iNSCs transfected with shH19) groups. There were no significant differences in the number of GFP+ and NeuN+ cells in the injured cortices of the two groups. However, the amount of GFP+/NeuN+ iNSC-derived neurons was significantly higher in the shH19 group than in the control group, suggesting that H19 inhibition promoted the neural differentiation of intracerebral-transplanted iNSCs in the injured cortices of CHI mice (P = 0.0013; Figure 7F and G). These data suggested that H19 suppressed the neural differentiation of iNSCs in vivo.