神经退行性病
-
Figure 2|Upregulation of microglial TREM-1 in a PD model.
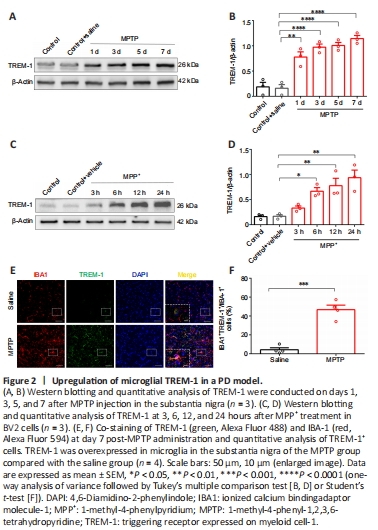
To investigate TREM-1 in PD progression and profile variations in its time course of expression, TREM-1 protein levels were examined in SN after MPTP administration, and in BV2 cells in the MPP+ model. The expression of microglial TREM-1 was upregulated in SN from MPTP-injected mice and MPP+-treated BV2 cells in vitro (Figure 2). Moreover, expression levels of TREM-1 in vivo were markedly upregulated on days 1, 3, 5, and 7 after final MPTP injection compared with the saline group, with a peak on day 7 after MPTP injection (Figure 2A and B). In parallel, TREM-1 levels in vitro were upregulated in BV2 cells following MPP+ exposure for 6, 12, and 24 hours compared with the control group, with a peak at 24 hours after MPP+ treatment (Figure 2C and D). Accordingly, respective peak time points (7 days in vivo and 24 hours in vitro) were designated for subsequent experiments.
We used IBA1 to label microglia. The expression of TREM-1 in microglia of SN was determined by double immunofluorescence staining on day 7 after MPTP injection. TREM-1 was overexpressed in microglia in SN in the MPTP group compared with the saline group (Figure 2E and F). Moreover, TREM-1-positive cells mainly colocalized with IBA1-positive microglia. In brief, these results confirmed that upregulation of TREM-1 in microglia was implicated in PD pathogenesis.
Figure 3|TREM-1 knockout decreases MPTP-induced dyskinesia and dopaminergic neurodegeneration in the subacute PD mouse model.
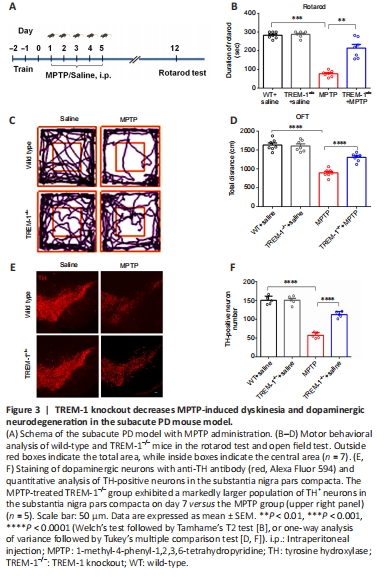
To determine the role of TREM-1 in the MPTP-induced mouse model of PD, WT and TREM1–/– mice underwent MPTP injection, with a control group receiving normal saline injection. Figure 3A shows the time course for establishment of a subacute PD model with MPTP administration. The rotarod test was performed on day 7 after the final MPTP injection. The mice performed poorly on the rotarod test and open field test, indicating significant impairment of motor activity. In contrast, MPTP-induced dyskinesia was significantly alleviated in the TREM-1–/– group versus MPTP group (Figure 3B–D). We selected TH as a marker to label dopaminergic neurons. The MPTP-treated TREM-1–/– group exhibited a markedly larger population of TH+ neurons in SN on day 7 versus the MPTP group (Figure 3E and F).
Figure 5|Microglial TREM-1 induces activation of CARD9/NF-κB signaling via interaction with SYK.

Activation of TREM-1 is reported to cause recruitment and activation of the SYK kinase, triggering activation of the CARD9/NF-κB pathway (Xu et al., 2019; Wu et al., 2021b). Accordingly, we examined the effect of MPTP injection or MPP+ treatment on TREM-1 and SYK in SN and BV2 cells. TREM-1 co-localized with microglial SYK, thereby validating their interaction (Figure 5A). Co-immunoprecipitation further demonstrated that TREM-1 interacted with SYK both in vivo and in vitro (Figure 5B and C). To determine whether TREM-1 is involved in the pathological process of PD, we used TREM-1–/– mice. To verify TREM-1 depletion in the TREM-1 knockout group, brain tissue from TREM-1–/– and WT mice were examined. Western blotting revealed upregulation of TREM-1 after MPTP injection in WT mice, whereas TREM-1–/– mice showed no TREM-1 (Figure 5D and E), confirming successful TREM-1 gene knockout in these mice. To determine whether microglial TREM-1 can recruit SYK for downstream activation of the CARD9/NF-κB pathway, western blotting showed upregulated expression of SYK, p-SYK, CARD9, p65, p-p65, IL-1β, and TNF-α after MPTP injection. However, knockout of TREM-1 significantly downregulated expression of SYK, p-SYK, CARD9, p65, p-p65, IL-1β, and TNF-α (Figure 5F–M). In parallel, we cultured BV2 cells with TREM-1 inhibitory peptide LP17 or control peptide prior to MPP+ challenge. Intriguingly, MPP+ treatment resulted in an increase of TREM-1, SYK, p-SYK, CARD9, p65, p-p65, IL-1β, and TNF-α, which was reversed by LP17 administration (Figure 5N–V). This further supports the role of microglial TREM-1 in mediating the inflammatory response.
Figure 7|TREM-1 knockout suppresses chemokine production and neutrophil invasion.
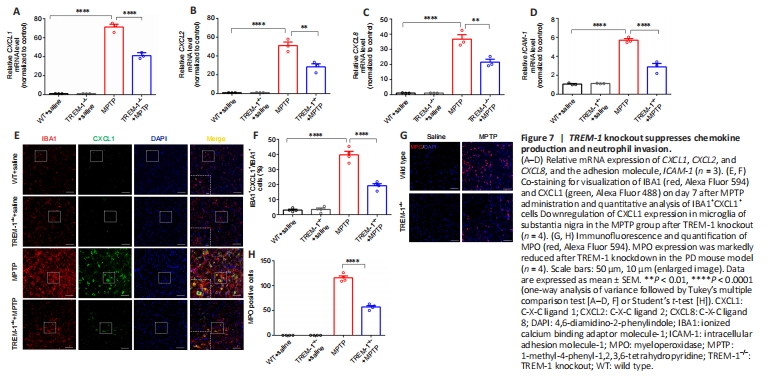
Given the implication of TREM-1 in exacerbating the inflammatory response in innate immunity (Colonna, 2003; Ford and McVicar, 2009; Lu et al., 2021), we investigated the effect of TREM-1 knockout on peripheral neutrophil infiltration of the inflammatory response. We used quantitative reverse transcription-polymerase chain reaction to quantify chemokine-related genes (CXCL1, CXCL2, and CXCL8) and ICAM-1. Knockout of TREM-1 inhibited chemokine generation and caused a reduction in ICAM-1 levels (Figure 7A–D). A priori, we hypothesized that the chemokines were secreted by microglia and that their upregulation contributes to peripheral neutrophil infiltration. To examine this hypothesis, we conducted double immunofluorescence staining of CXCL1 and IBA1 on day 7 after MPTP injection. The majority of CXCL1-positive cells and IBA1-positive microglia were colocalized. Immunofluorescence staining revealed downregulation of CXCL1 expression in microglia of SN in the MPTP group after TREM-1 knockout (Figure 7E and F). This suggests a potential association between TREM-1 knockout and neutrophil infiltration in the MPTP model. We selected MPO as a marker of neutrophils, and confirmed that TREM-1 knockout mitigated neutrophil infiltration into SN (Figure 7G and H).
Figure 8|Pharmacological inhibition of TREM-1 in microglia suppresses chemokine production and neutrophil migration in vitro.

To further validate our finding that microglial TREM-1 activation releases chemokines to incite neutrophil infiltration, we used ELISA to detect the levels of chemokines (CXCL1, CXCL2, and CXCL8) in MPP+-challenged BV2 cells in the presence of LP17 (Figure 8A). This showed that LP17 administration suppressed chemokine production (Figure 8B–D). Subsequently, we used a Transwell experiment to determine the effect of pharmacological inhibition of microglial TREM-1 levels on neutrophil migration. This showed significant inhibition by LP17 administration versus MPP+ challenge (Figure 8E–G).
Figure 9|Activation of neutrophil TREM-1 mediated dopaminergic neuronal apoptosis.

Despite the finding of neutrophil infiltration into SN, controversy remains regarding the effect of neuroinflammation on neutrophil TREM-1. Hence, we used MPO to label neutrophils, and examined TREM-1 expression in neutrophils in SN by double immunofluorescence staining on day 7 after MPTP injection. TREM-1+ cells mainly colocalized with MPO+ neutrophils, and TREM-1 was increased in neutrophils of SN (Figure 9A and B). Additionally, to further confirm whether an inflammatory reaction can activate neutrophil TREM-1 expression, neutrophils were isolated from mouse bone marrow and exposed to LPS (100 ng/mL) for 4 hours in the presence or absence of LP17. TREM-1 expression was increased after LPS treatment versus the control group. LP17 administration reversed the LPS-mediated TREM-1 upregulation in neutrophils (Figure 9C–E). In brief, our findings further confirmed the potential role of TREM-1 in peripheral neutrophils in PD.
To determine whether inhibition of TREM-1 expression in neutrophils affected neuronal viability, SH-SY5Y neurons were cultured with CM from LPS-treated neutrophils with or without LP17. ELISA showed downregulated expression of IL-1β and TNF-α in CM from TREM-1-inhibited neutrophils versus LPS-treated neutrophils (Figure 9F–H). Flow cytometry further revealed diminished apoptosis of SH-SY5Y cells with exposure to CM from TREM-1-inhibited neutrophils versus LPS-treated neutrophils (Figure 9I–K).