神经退行性病
-
Figure 1|Characterization of NSC-ex.
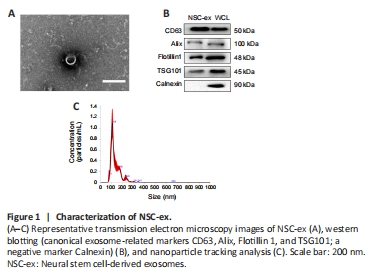
We previously showed that extracellular vesicles derived from NSCs stimulate the secretion of several important regulators of mitochondrial function in the cortex of mice. To further explore the impact of NSC-ex, as well as SIRT1, on mitochondrial biogenesis we generated a novel nervous system-specific SIRT1 conditional knockout APP/PS1 mouse model and conducted a series of experiments using this model, together with APP/PS1 GFAP-Cre+ Green mice. NSC-ex were isolated by ultracentrifugation (Chen et al., 2018a, b; Pan et al., 2020) and appeared as round, cup-shaped particles 30–150 nm in diameter with a double-layer membrane structure by TEM (Figure 1A), consistent with an earlier report (van Niel et al., 2018). The identity of the NSC-ex was also confirmed by nanoparticle tracking analysis (Figure 1C), as well as immunoblotting analysis with the negative marker Calnexin and the canonical exosome-related markers CD63, Alix, Flotillin 1, and TSG101 (Figure 1B). Successful construction of the SKO-AD mouse model was confirmed by the absence of SIRT1 mRNA and protein expression in the brain (Additional Figure 1).
Figure 3|NSC-ex promote SIRT1 and PGC1α secretion and improve mitochondrial function in an Aβ-induced HT22 cell injury model.
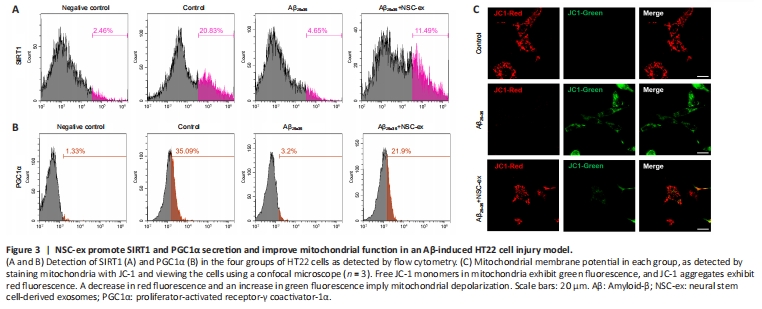
Mitochondrial damage is an early event in AD pathogenesis. PGC1α, NRF1, and COXIV are all crucial mitochondrial biogenesis-related factors. PGC1α, a transcriptional regulatory factor, activates gene transcription, protects neurons from oxidative damage, promotes ATP production during bioenergetic crises, maintains energy homeostasis, and prevents cell necrosis and apoptosis (Rius-Perez et al., 2020). NRF1 is a transcriptional partner of PGC1α and controls the expression of mitochondrial transcription factor A, which is vitally important for regulating DNA replication and the transcription of mitochondrial genes (Liu et al., 2021). COXIV, a protein that is specifically expressed in mitochondria, is an indirect indicator of mitochondrial biogenesis, and defective COXIV protein expression have been found senile plaques in patients with dystrophic neuritis or AD (Perez-Gracia et al., 2008; Zhou et al., 2023). We first asked whether there was a correlation between SIRT1 and PGC1α expression levels after NSC-ex treatment in vitro. We found that the fluorescence intensities of SIRT1 and PGC1α were significantly lower in the Aβ25–35-treated group and dramatically higher after NSC-ex treatment (Figure 3A and B). Next, we assessed the mitochondrial membrane potential (MMP), which is an indicator of intracellular homeostasis and mitochondrial energy status. Aβ25–35 infiltration into HT22 cells stimulated massive JC-1 green fluorescence, indicating MMP loss (Figure 3C). NSC-ex improved the MMP performance, indicating that NSC-ex preserve mitochondrial function.
Figure 5| NSC-ex restore normal PGC1α distribution in the brain in an AD mouse model.

2D immunofluorescence is typically used to detect changes in the distribution of proteins in tissues of interest, but is limited by the need to perform multiple sets of same operations simultaneously, the inability to control some experimental details, and the inability to detect holistic differences. Here, we used whole-brain clearing, immunostaining, and lightsheet imaging to investigate the distribution of PGC1α, NRF1, and COXIV at the whole-brain level. Additional Video 1 shows a representative view of PGC1α and GFAP fluorescence in the AD-Veh group. To better display the spatial distributions of these factors in the mouse brains, three angles of the 3D images are presented here, namely the transverse angle (Figure 5Da), the coronal angle with the head end 30 degrees upwards (Figure 5Db), and the side angle (Figure 5Dc). Negative controls were included to ensure the authenticity and specificity of the fluorescence signal, and no obvious fluorescence was observed in the negative controls (Additional Figure 2). Overall distribution trends were determined based on a combination of 3D viewer and corresponding 2D images to identify specific fluorescence signals.
In general, we found that PGC1α was diffusely and abundantly distributed throughout the brain of WT mice (Figure 5Aa and b, Bg). Fluorescence signal intensity analysis (Figure 5E) indicated slightly higher PGC1α expression in the hippocampal, cortical, and striatal regions, and no obvious regions of hypo-fluorescence. Representative enlarged images of the hippocampus (Additional Figure 3h1–h4), corpus striatum (Additional Figure 3s1 and s2), thalamus (Additional Figure 3t1), midbrain (Additional Figure 3m1), cortex (Additional Figure 3s2, o1 and c2), and cerebellum (Additional Figure 3c1) are shown. However, unlike the WT group, brains from both the AD-Veh group (Figure 5Ac and d, 5Bh) and the AD-ex group (Figure 5Ae and f, Bi) showed markedly heterogeneous distribution of PGC1α, especially the AD-Veh group. Compared with that of WT mice, the whole-brain PGC1α fluorescence intensity of AD-Veh mice (Figure 5F) was significantly lower, and the distribution of PGC1α was altered, indicating that PGC1α expression decreased differentially in multiple brain regions, most notably in the hippocampus, cortex, thalamus and brainstem. This finding is consistent with the WB results. After NSC-ex treatment, we observed markedly increased PGC1α expression levels in multiple brain regions, including the striatum (Figure 5Cj), cortex (Figure 5Ck and l), hippocampus (Figure 5Cm), cerebellum (Figure 5Cn), midbrain (Figure 5Co), and more. PGC1α distribution was severely disrupted in AD mouse brains (Figure 5Ac and d, Bh), but less so in brains from the AD-ex group (Figure 5Ae and f, Bi). The fluorescence intensity results (Figure 5F and G) revealed that the regions with the most pronounced increase in PGC1α expression in the AD-ex group were hippocampus and cortex, which is also consistent with the WB results. Interestingly, the decrease in PGC1α expression from the inner to the outer layer of the cortex of WT group was very slight (Figure 5Ck and l [WT group]), whereas treatment with NSC-ex tended to drastically increase PGC1α expression in the medial cortex (Figure 5Ck and l [AD-ex group]). Taken together, our findings demonstrate that AD disrupts normal PGC1α distribution in the brain, and that NSC-ex reverse this effect in multiple brain regions.
Figure 6|NSC-ex restore normal distribution of NRF1 and COXIV.
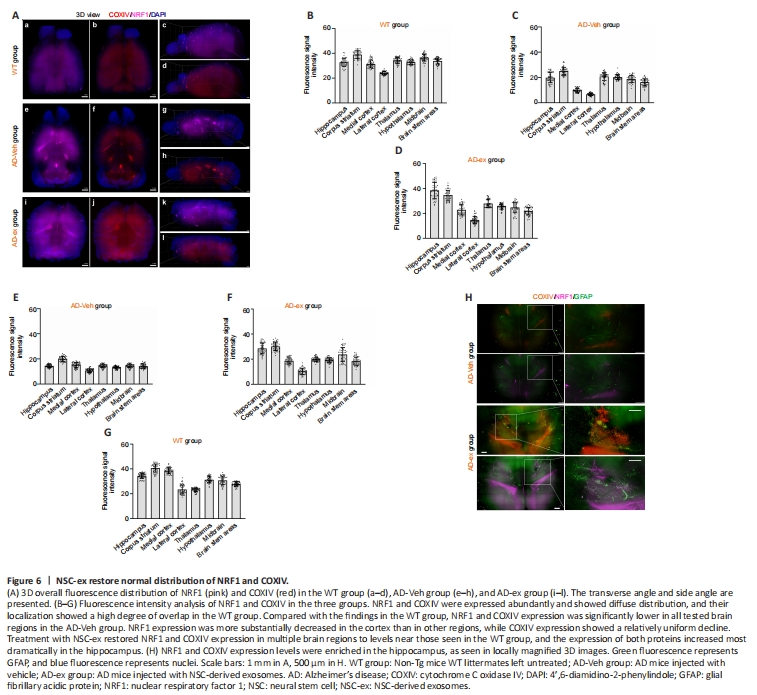
NRF1 and COXIV fluorescence signals were detected simultaneously in mouse brains. Combining 3D views and fluorescence signal intensity analysis showed that NRF1 and COXIV were abundantly expressed in WT mice, and their spatial distributions overlapped substantially (Figure 6Aa–d, B, and G). Compared with those in the WT group, NRF1 and COXIV expression levels were significantly lower in all tested brain regions in the AD-Veh group. However, NRF1 expression was decreased to a greater extent in the cortex than other regions, while COXIV expression showed a relatively homogenous decline (Figure 6Ae–h, C, and E). Treatment with NSC-ex restored NRF1 and COXIV expression in multiple brain regions to levels close to those seen in WT brains, with the most striking enrichment seen in the hippocampus (Figure 6Ai–l, D, F, and H), indicating that significant protein synthesis occurs in this region. These observations are consistent with our WB results (Figure 4C), which showed that NRF1 expression recovered more fully than COXIV expression in the hippocampus. Moreover, significant fluorescence hyperintensities were observed in the lateral ventricles of AD-Veh and AD-ex groups (Figure 6Ae–l, H), which could be attributable to the accumulation of specific antibodies in these local cavities. Hence, NSC-ex rescue the AD-induced reduction in NRF1 and COXIV expression to varying degrees, restore their normal distribution patterns, and most noticeably affect the hippocampus.
Figure 7|NSC-ex suppress astrocyte activation at the whole-brain level.
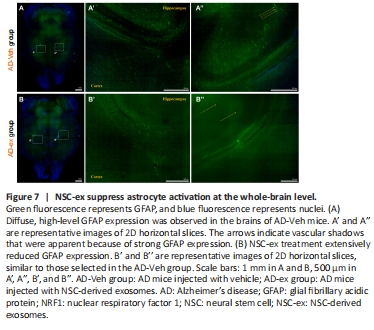
In the AD-Veh and AD-ex groups, we observed autofluorescence from GFAP-Cre+ Green. AD development is accompanied by neuroinflammation and astrocyte activation (Kaur et al., 2019). GFAP is the intermediate filament protein in astrocytes and is a recognized marker protein for astrocytes (Li et al., 2020b). The degree of up-regulation of GFAP expression represents the degree of astrocyte proliferation. Strong or weak GFAP expression reflects the functional status of astrocytes under normal or pathological conditions, respectively. We observed diffuse high-level GFAP expression in the brains of all tested AD-Veh mice, indicating that AD causes astrocyte activation at the whole-brain level, whereas treatment with NSC-ex dramatically reduced this signal (Figure 7). Considering the limitations of the whole-brain CUBIC assessment, which does not achieve single-cell resolution, we verified the decrease in GFAP expression after NSC-ex intervention by WB (Additional Figure 4).