脑损伤
-
Figure 1|Effect of different frequencies of rTMS on NSC proliferation.
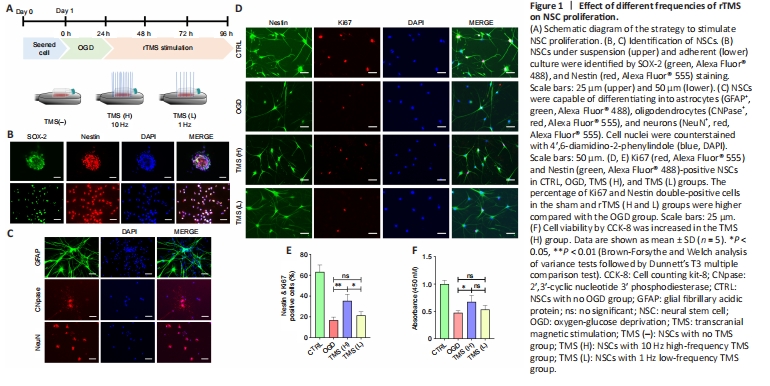
Most of the cells isolated from fetal rat brain developed into NSC aggregates within 48 hours. Nestin and SOX-2, common markers of NSCs (Urbán et al., 2019), were found to be expressed in NSC aggregates and adherent NSCs (Figure 1B). After the addition of a specific differentiation medium, NSCs were able to develop into GFAP+ astrocytes, CNPase+ oligodendrocytes, or NeuN+ neurons (Figure 1C). These findings indicate that we were successful in differentiating NSCs and characterizing their phenotype.
To verify whether rTMS contributes to the proliferation of NSCs, we investigated the effects of different frequencies (1 and 10 Hz) of rTMS on NSCs. We evaluated the proliferation of NSCs by Ki67 staining and identified NSCs using Nestin. Our in vitro rTMS experiments showed that the proliferation percentage of NSCs was higher in the TMS (H) group compared with the TMS (L) group, as indicated by population analysis of Nestin+/Ki67+ NSCs (Figure 1D and E). Cell counting kit-8 assay also indicated higher cell viability in the TMS (H) group than in the TMS (L) group (Figure 1F). Moreover, different rTMS frequencies did not visibly affect NSC apoptosis, as shown by TUNEL assay (Additional Figure 2A) and mRNA expression analysis of apoptosis-related markers (Bax and Bcl-2; Additional Figure 2B).
Figure 3|Effect of rTMS on NSC proliferation in the peri-infarct area.
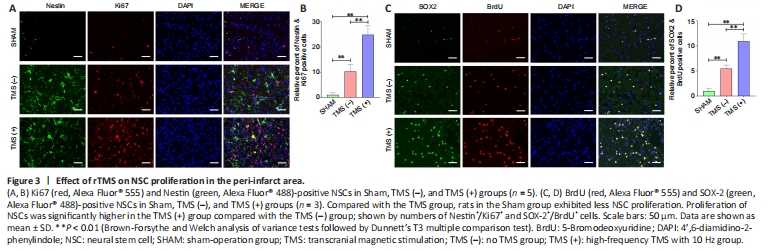
We further assayed NSC proliferation in peri-infarct tissue from experimental ischemia rats at 7 days after rTMS. Overall, sham group rats exhibited less NSC proliferation compared with the TMS group (Figure 3A and B). The proliferation of NSCs was significantly higher in the TMS (+) group than in the TMS (–) group, as assessed by Nestin+/Ki67+ (Figure 3A and B) and SOX-2+/
BrdU+ (Figure 3C and D) staining. These findings suggest that cerebral ischemia can stimulate the proliferation of NSCs, and that rTMS can improve the proliferative efficiency of these cells.Figure 5|Expression of phosphorylated-AKT (p-AKT), AKT, phosphorylated-GSK3β (p-GSK3β), GSK3β, and β-catenin in the nucleus of the ipsilateral hemisphere (excluding the infarct area).

We found that p-GSK3β expression significantly increased in the TMS (+) group on days 3 and 28 compared with the TMS (–) group and sham-operated animals. Consistent with this effect, levels of β-catenin in the nucleus, the downstream target of p-GSK3β, were also significantly increased in the TMS (+) group (Figure 5A). Moreover, immunofluorescence staining revealed that β-catenin is more likely to enter the nucleus of Nestin+ NSCs in the TMS (+) group than in the TMS (–) group and sham-operated animals (Figure 5B).
Our previous study showed that rTMS can promote the activation of AKT, which is thought to inhibit downstream GSK3β (Luo et al., 2017). To further explore whether rTMS promoted the proliferation of NSCs through the canonical Wnt signaling pathway, we analyzed the activity of this pathway in rat brain tissue following rTMS at various times. To confirm whether rTMS activates the GSK3β/β-catenin signaling pathway by promoting AKT activation, and thereby promoting NSC proliferation, we determined whether NSCs cultured in vitro were stimulated by rTMS, and whether each pathway activated or inhibited cell proliferation. We found that expression levels of p-AKT increased significantly in the TMS (+) group on days 3, 14, and 28 compared with the TMS (–) group and sham-operated animals (Figure 5A). In addition, rTMS also improved expression levels of p-GSK3β, p-AKT, and β-catenin in the nucleus of NSCs and their fluorescent signals (Figure 5C and D). Moreover, using an inhibitor of AKT activation (LY294002), the function of rTMS in promoting AKT activation and activating GSK3β/β-catenin signaling was inhibited (Figure 5E), as was the effect on promoting NSC proliferation.
Figure 6| rTMS activates AKT through the Ca2+/P2 calcium channel/CaM pathway.
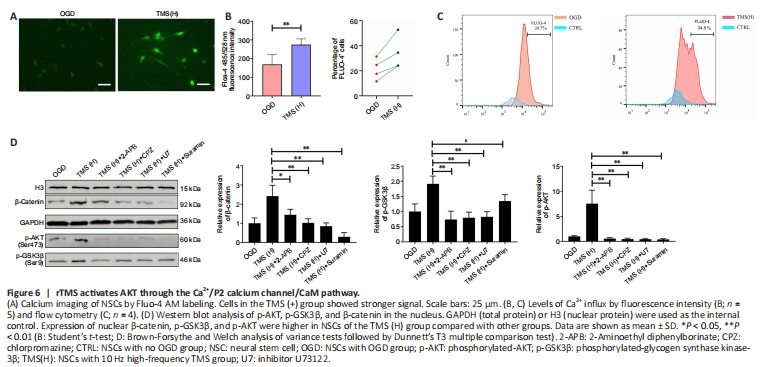
Recent studies have demonstrated that the AKT/GSK3β/β-catenin signaling pathway of bone marrow mesenchymal stromal cells can be inactivated by decreased Ca2+ flux, leading to the regulation of cell growth and proliferation in various cell types (Pinto et al., 2015). This suggests that Ca2+ flux may play a crucial role in the regulation of NSC proliferation by rTMS. Our findings indicate that rTMS can increase Ca2+ influx in NSCs (Figure 6A and B) and increase the proportion of Fluo-4 AM+ cells (Figure 6C). Moreover, rTMS-induced activation of the AKT/GSK3β/β-catenin signaling pathway was abolished by the calcium channel P2 antagonist, suramin (Figure 6D). Additionally, a phospholipase C inhibitor, U73122, inositol 1,4,5-trisphosphate receptor antagonist, 2-APB, and a recombinant calmodulin (CaM) antagonist, CPZ, all inhibited rTMS-induced AKT and GSK3β/β-catenin signaling pathway activation in NSCs (Figure 6D). Therefore, our results suggest that rTMS-induced activation of the AKT/GSK3β/β-catenin signaling pathway is dependent on Ca2+/P2 calcium channel/CaM signaling, which increases Ca2+ influx, potentially through the purinergic receptor Y–phospholipase C pathway and purinergic receptor X calcium activation.