视神经损伤
-
Figure 2| p38 MAPK inhibitor SB202190 protects R28 cells from glutamate-induced cell death.
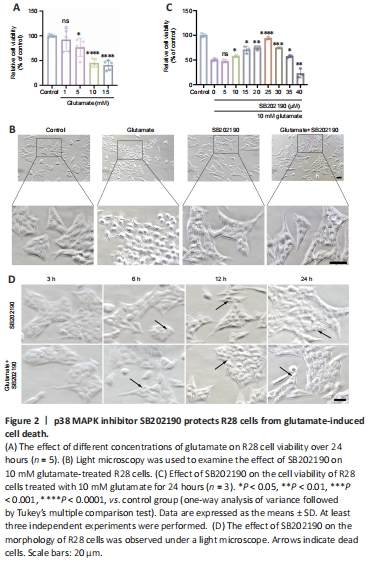
The R28 cell line has been widely used to explore the neuroprotection and pathological mechanism of RGCs in vitro in several studies (Dai et al., 2022; Liu et al., 2022; Yao et al., 2023). To explore the effects of SB202190 on glutamatergic toxicity, we used R28 cells as an in vitro model. We cultured R28 cells for 24 hours with various concentrations of glutamine and found that cell viability was approximately 50% in the presence of 10 mM glutamate (Figure 2A). Therefore, we chose 10 mM for subsequent experiments.
Light microscopy showed that untreated R28 cells exhibited a spindle-shaped morphology with tight intercellular connections (Figure 2B). After 24 hours of glutamate treatment, most cells underwent morphological changes, appearing rounded, and the intercellular connections gradually disappeared. SB202190 exhibited protective effects on R28 cells by inhibiting p38 MAPK. CCK-8 assay showed that SB202190 had a protective effect on R28 cells treated with glutamate (Figure 2C). While glutamate reduced cell viability (48.98%), co-treatment with 10 μM SB202190 increased viability to 57.73% (P < 0.05). At 25 μM SB202190, cell viability reached 93.79% (P < 0.0001) and then began to decrease with increasing drug concentration (P < 0.05). Excessively high concentrations of SB202190 may have caused toxicity. We therefore chose 25 μM for subsequent experiments.
We examined cell morphology after drug treatment under a light microscope and detected vesicle-like structures with SB202190 treatment (Figure 2D). These were detected at 12 hours and were more obvious at 24 hours.
Figure 3| p38 MAPK inhibitor SB202190 protects R28 cells from glutamate-induced ferroptosis.

We next examined whether the glutamate-induced death of R28 cells involved ferroptosis and explored whether the rescue effect of SB202190 was associated with reversal of ferroptosis. Ferrostatin-1 is a classical inhibitor of ferroptosis (Miotto et al., 2020) and was used as a positive control. Hoechst/PI staining showed that both SB202190 and ferrostatin-1 significantly reduced glutamate-induced cell death (Figure 3A and B). Transmission electron microscopy revealed that the glutamate-treated group showed morphological changes indicative of ferroptosis (Dixon et al., 2012), such as mitochondrial shrinkage, reduction of mitochondrial cristae and mitochondrial outer membrane rupture. Notably, the mitochondrial damage induced by glutamate was prevented by SB202190 treatment (Figure 3C). Iron and lipid peroxide accumulation are important biochemical features of ferroptosis (Chen et al., 2021). The intracellular iron content was detected using Mito-FerrOrange. The fluorescence intensity in the glutamate group increased, indicating that intracellular iron was elevated by glutamate treatment (Figure 3D and E). Upon co-treatment with SB202190, the fluorescence intensity decreased (P < 0.001). We next used Liperfluor to detect intracellular lipid peroxides. The fluorescence intensity was significantly increased in the glutamate group compared with the control group (P < 0.001) and decreased upon SB202190 treatment (Figure 3F and G). MDA and GSH assays were also used to detect changes in intracellular lipid peroxidation levels. MDA levels were significantly increased in the glutamate group compared with the control group (P?< 0.0001), while it was significantly decreased with SB202190 co-treatment (P < 0.01; Figure 3H). While GSH was significantly decreased in the glutamate group compared with the control group (P < 0.001), co-treatment with SB202190 did not significantly increase levels (Figure 3I). We suggest that this may be because scavenging excess reactive oxygen species (ROS) depletes intracellular GSH. At the time point of observation, though the alived R28 in SB202190 group could continuely synthesized GSH, the part of synthesized GSH cannot compensate the part of depleted.
Figure 4| p38 MAPK inhibitor SB202190 regulates ferroptosis in a glutamate R28 cell model by regulating FTL and SAT1.
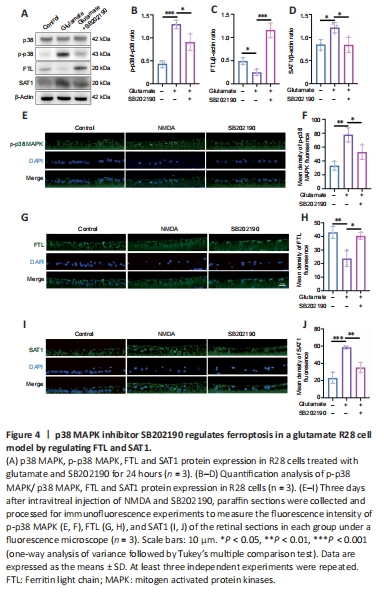
p38 MAPK is activated upon phosphorylation (English and Cobb, 2002). We detected the expressions of p38 and p-p38 in R28 cells after drug treatment by western blotting (Figure 4A and B). We found that p-p38 MAPK/p38 MAPK increased in the glutamate group compared with control group (P < 0.001) and SB202190 co-treatment decreased the level (P < 0.05). This was also supported by the results of immunofluorescence staining of paraffin sections from animal models. The fluorescence intensity of p-p38 MAPK labeling in RGCs of NMDA group was higher than that in the other two groups (Figure 4E and F).
We also used qRT-PCR to examine the mRNA levels of p38 MAPK (Additional Figure 1). We found no significant difference in the mRNA levels of p38 MAPK between the control group and the glutamate group (P > 0.05). However, p38 MAPK mRNA level increased in the SB202190 group compared with the glutamate group (P < 0.01). However, this is not contradictory to the results obtained from western blot, as an increase in mRNA levels may not necessarily reflect the level of protein phosphorylation.
To further explore the mechanism of SB202190 on glutamate-induced ferroptosis, we examined the expression of ferroptosis-related proteins. Western blot showed that FTL expression decreased and SAT1 expression increased in glutamate-treated R28 cells compared with controls (P < 0.05; Figure 4A, C, and D). SB202190 co-treatment reversed the effects of glutamate on the expression of these two proteins (P < 0.05). We also performed qRT-PCR to measure the mRNA levels of FTL and SAT1 (Additional Figure 1). While the mRNA level of FTL was unchanged by glutamate treatment, FTL mRNA increased with SB202190 co-treatment (P < 0.05); the mRNA level of SAT1 increased with glutamate treatment and decreased with SB202190 co-treatment (P < 0.05). Fluorescence microscopy of paraffin sections from animal models revealed that the trend of FTL and SAT1 fluorescence intensity changes was compatible with the results of cell experiments (Figure 4G–J). FTL expression was decreased and SAT1 expression increased in the NMDA group compared with the control group. Addition of SB202190 prevented the changes induced by NMDA.
Figure 5| p38 MAPK inhibitor SB202190 alleviates lipid peroxidation by regulating the SLC7A11/GSH/GPx4 pathway.
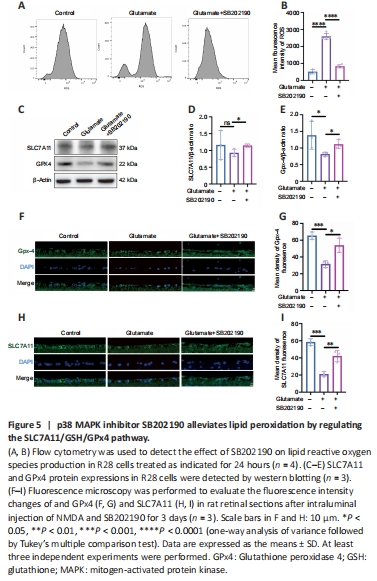
We examined intracellular ROS content after drug treatment of R28 cells (Figure 5A and B). Glutamate increased ROS relative to the control group (P < 0.0001), and the mean fluorescence intensity (MFI) value of ROS in glutamate group was approximately 5.13-fold of that in control group. However, the MFI significantly decreased with co-treatment of SB202190 compared with glutamate alone (P < 0.0001). The SLC7A11/GSH/GPX-4 axis is the main intracellular antioxidant system that protects against ferroptosis and regulates lipid reactive oxygen species production (Jiang et al., 2021). Our results showed SB202190 co-treatment did not impact glutamate-induced GSH changes in R28 cells (Figure 3I). We also examined SLC7A11 and GPX-4 protein expression in R28 cells (Figure 5C–E). SLC7A11 protein showed no significant changes between the glutamate and control groups (P > 0.05). However, SLC7A11 increased after SB202190 co-treatment compared with glutamate alone (P < 0.05). GPX-4 expression was lower in the glutamate group than in the control group (P < 0.05) and it increased with co-treatment of SB202190 (P < 0.05). We used qRT-PCR to detect the mRNA levels of SLC7A11 and GPX-4 (Additional Figure 1). Both SLC7A11 and GPX-4 mRNA levels showed a significant increase upon SB202190 co-treatment compared with glutamate alone (P < 0.05). Immunofluorescence analysis of paraffin sections of animal models showed that the trend of SLC7A11 and GPX-4 expression changes were compatible with the results in R28 cells (Figure 5F–I).
Figure 6| p38 MAPK inhibitor SB202190 attenuates N-methyl-D-aspartate (NMDA)-induced damage in the rat retina.
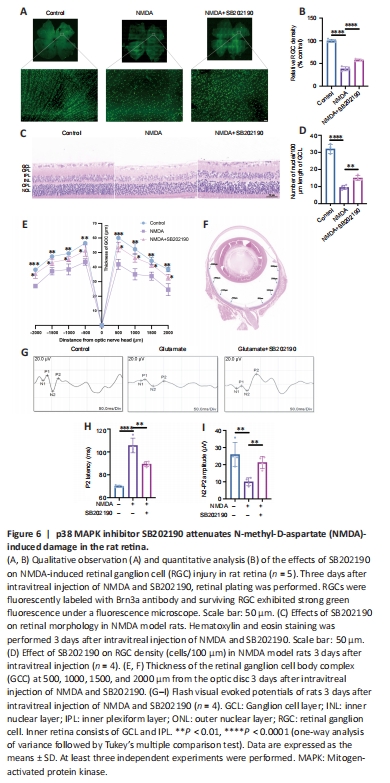
NMDA binds to NMDA receptors on RGCs to induce excitatory retinal damage (Doozandeh and Yazdani, 2016). We established an glutamate excitotoxicity glaucoma animal model by intravitreal injection of NMDA in rats. To assess the effects of SB202190 on retinas from NMDA model animals, we performed retinal tiling and immunofluorescence staining with Brn3a antibody, which is used to identify and quantify RGCs in the retina (Nadal-Nicolás et al., 2009; Figure 6A and B). After 3 days of intravitreal injection, the density of RGCs in the retina in the NMDA group was significantly reduced to approximately 38.16% relative to the control group (P < 0.0001). After treatment with SB202190, the damage of RGCs induced by NMDA was reduced and the density of RGCs was restored to 57.57% of the control group (P < 0.0001). We further performed H&E staining to observe the retinal morphology (Figure 6C). At 3 days after intravitreal injection, the number of nuclei in the GCL per 100 μm was reduced to approximately 29.67% of that in the control group and increased to 46.88% in the SB202190-treated group (P < 0.01; Figure 6D). We further determined the thickness of the retinal ganglion cell body complex (GCC) at 500, 1000, 1500, and 2000 μm from the optic center of optic disc. The GCC was thinner at all measurement points in the NMDA group compared with the control group (P < 0.05). The damage induced by NMDA was prevented in the SB202190-treated group (Figure 6E and F). Müller cells are neuroglial cells that play an important regulatory role in retinal metabolism, which are essential for extracellular glutamate clearance and the synthesis of intraretinal glutamate and GABA (Pfeiffer et al., 2020; Xu et al., 2022). Glutamine synthetase (GS) is the major neuroglial enzyme involved in extracellular glutamate clearance by Müller cells (Villar et al., 2023). We found that intravitreal injection of NMDA increased the expression of GS in Müller cells in the rat retina to some extent (Additional Figure 2).
f-VEP is a common examination for the clinical assessment of visual conduction function. The f-VEP amplitude is considered as an indicator of the receptive function of the intact synaptic contacts number. The f-VEP latency is considered as an indicator of nerve conduction and axon myelin sheath integrity (Li et al., 2018) We evaluated the effects of SB202190 on the latency and amplitude of P2 wave in the NMDA model by detecting flash visual evoked potential (Figure 6G). At 3 days after NMDA treatment, the latency of P2 wave was prolonged and the amplitude was reduced compared with observations in the control group (Figure 6H and I), indicating that intravitreal NMDA injection caused retinal dysfunction in rats. SB202190 treatment partially restored the P2 wave.