脊髓损伤
-
Figure 2|In vitro fluorescence analysis of the recombinant vegf165, gdnf, and ncam1 expression in the genetically-enriched leucoconcentrate 72 hours after transduction of the leucoconcentrate simultaneously transduced with adenoviral vectors Ad5/35-VEGF165, Ad5/35-GDNF, and Ad5/35-NCAM1 in equal ratio at multiplicity of infection = 10.
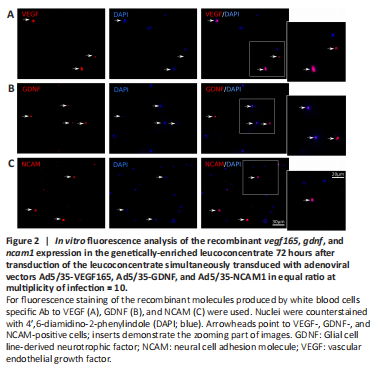
Immunofluorescence staining of the mini-pig leucoconcentrate enriched with recombinant genes vegf165, gdnf, and ncam1 was completed 72 hours after incubation of the samples using specific antibodies to VEGF, GDNF, and NCAM. Fluorescence microscopy revealed VEGF-, GDNF-, and NCAM-immunopositive WBC (Figure 2).
Figure 3|Sparing of the spinal cord tissue in the control and treated animals 60 days after spinal cord contusion injury.
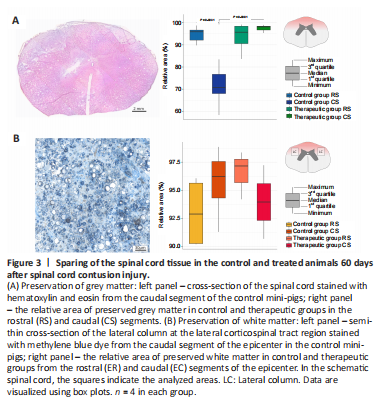
In this study, a model of moderate contusion spinal cord injury presumes the hit to the dorsal side of the spinal cord with a metal rod. Thus, the main damage is caused in the dorsal horns and dorsal and lateral columns. On the total cross-sections of the spinal cord in the RS and CS segments, we evaluated the area of the pathological cavities in the grey matter in the dorsal horns. The morphometric analysis revealed the difference between the sparing area of the grey matter in the dorsal horns in the RS and CS segments in experimental animals (Figure 3A). In the RS segment, the sparing area of grey matter did not differ between the control and therapeutic groups. In the CS segment, a more preserved nervous tissue area was shown in the treated mini-pigs compared with that in the control animals (P < 0.0001). Important, there was less sparing in CS than in RS in the control group (P = 0.0091) and no difference in the therapeutic group. The study of the white matter sparing in the region of the lateral corticospinal tract in the ER and EC segments of the epicenter of the injury revealed pathological cavities as well. Morphometric analysis of the lesion area in the studied regions did not differ in the control and treated mini-pigs (P = 0.4397; Figure 3B).
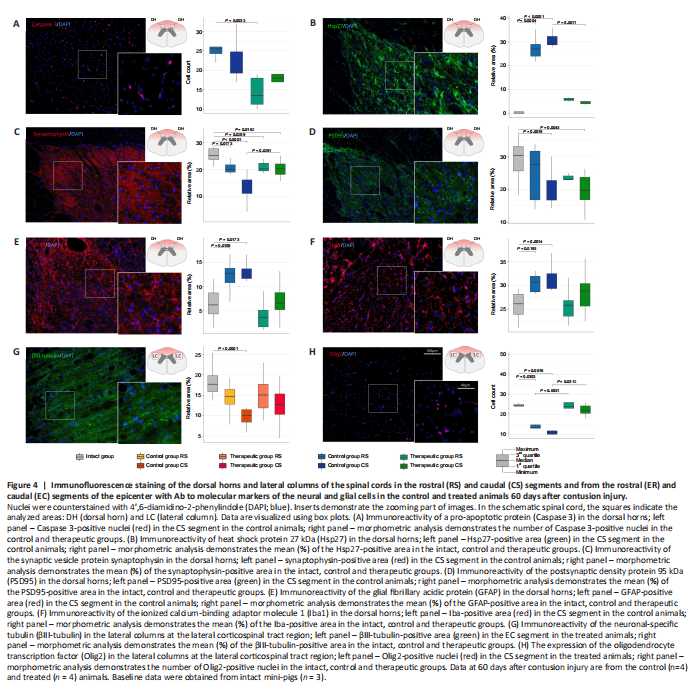
Figure 4| Immunofluorescence staining of the dorsal horns and lateral columns of the spinal cords in the rostral (RS) and caudal (CS) segments and from the rostral (ER) and caudal (EC) segments of the epicenter with Ab to molecular markers of the neural and glial cells in the control and treated animals 60 days after contusion injury.
Survivability of spinal cord cells
The number of the pro-apoptotic protein Caspase 3-positive cells in the dorsal horns in the control mini-pigs was significantly higher than that in treated animals in the RS segments (P = 0.0033) and did not differ between them in the CS segments (P > 0.05; Figure 4A). Evaluation of the cellular stress protein Hsp27-positive relative area demonstrated the significant increase of Hsp27 expression in the control animals in the RS segment (P = 0.0004) and the CS segment (P < 0.0001) compared with intact mini-pigs. However, the level of Hsp27 expression in the therapeutic group in the RS segment and the CS segment did not differ from intact data (Figure 4B).
Expression of synaptic proteins
Recovery of the synaptic protein expression was evaluated using antibodies to the synaptic vesicles protein synaptophysin and PSD95. The average immunopositive area for synaptophysin was significantly decreased in the RS and CS segments both in the control (RS, P = 0.0173; CS, P < 0.0001) and therapeutic (RS, P = 0.0259; CS, P = 0.0162) groups compared with that in the intact group. However, the synaptophysin-immunopositive area was significantly higher in the CS segment in treated mini-pigs compared with that in the control animals (P = 0.0251; Figure 4C). Moreover in the control group in CS, the expression of synaptophysin was significantly lower than in RS (P = 0.0251). The analysis of PSD95 expression showed that the PSD95-immunopositive relative area was significantly decreased in the CS segment in the control (P = 0.0019) and therapeutic groups (P = 0.0043) and did not differ in the RS segment in the control and treated animals compared with intact mini-pigs (Figure 4D).
Astrogliosis
The activation of microglia and astrocytes result in reactive astrogliosis. Analysis of astrocytes in the dorsal horns revealed a higher GFAP-immunopositive area in the control mini-pigs in the RS segment (P = 0.0105) and in the CS segment (P = 0.0173) in comparison with intact animals (Figure 4E). In the therapeutic group, the GFAP-immunopositive area in the RS and CS segments did not differ from the intact animals. The analysis of microglial cell activation demonstrated the same pattern of changes. The increased Iba1-immunopositive area was observed in the control group in the RS (P = 0.0193) and CS (P = 0.0014) segments in comparison to intact animals (Figure 4F). In the therapeutic group, the Iba1-immunopositive area in the RS and CS segments was similar to the values of the intact group.