神经损伤与修复
-
Figure 1|Lentiviral construction and mesenchymal stem cell transduction.
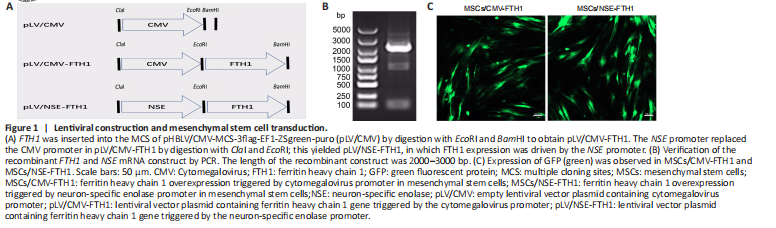
The upstream region of the NSE gene (NSE promoter, 1.8 kb) was amplified by polymerase chain reaction (PCR) using rat genomic DNA as a template, in accordance with previous reports (Peel and Klein, 2000). The following primers were used: forward, 5′-ATG CTC TAG ACT CGA GAG CTC TGA GCT CCT CCT CTG CTC GC-3′; reverse, 5′-CAT GGT GGC GAC CGG TTC GAG GAC TGC AGA CTC AGC CG-3′. The rat FTH1 gene (NM_012848) was synthesized by PCR using the following primers: forward, 5′-AGG TCG ACT CTA GAG GAT CCG GGC CCT ACG TGC TGT CTC ACA CAG CC-3′; and reverse, 5′-ACC GTA AGT TAT GTG CTA GCT TAT TTG TCG TCA TCA TCC TTA TAG TC-3′. FTH1 was inserted into the lentiviral vector through digestion with EcoRI and BamHI to obtain the recombinant lentiviral vector pLV/CMV-FTH1. Then, the cytomegalovirus (CMV) promoter in pLV/CMV-FTH1 was replaced by the NSE promoter (NSE) using ClaI and EcoRI digestion to obtain pLV/NSE-FTH1, in which the NSE promoter controlled the expression of FTH1 (Figure 1A). The recombinant complementary DNA sequences of the FTH1 gene and NSE promoter were confirmed by DNA sequencing and PCR. The recombinant vectors were confirmed by DNA sequencing, a double digestion system, and agarose gel electrophoresis. The pLV/NSE-FTH1 or pLV/CMV-FTH1 vectors and the packaging plasmids pMD2G and pSPAX2 (Hanbio Biotechnology Co., Ltd. Shanghai, China; Cat# LV011) were co-transfected into 293T packaging cells (Chinese Academy of Sciences, Beijing, China; Cat# GNHu 43; RRID: CVCL_0045) to obtain lentiviruses for transduction experiments. Six hours after transfection, fresh medium with 10% fetal bovine serum was supplemented; viral medium was collected 48 and 72 hours later. Centrifugation at 4000 × g was performed for 10 minutes at 4°C to remove cellular debris. Virus particles were collected by centrifugation at 82,700 × g for 2 hours at 4°C, then stored at –80°C.
To ensure FTH1 was expressed only when MSCs differentiated into NLCs, FTH1 expression was controlled by the NSE promoter. PCR confirmed that the length of the recombinant FTH1 and NSE mRNA construct was between 2000 and 3000 bp (Figure 1B), which was consistent with the sum of their individual lengths. Furthermore, gene sequencing confirmed that the sequences of the FTH1 gene and NSE promoter were correct (Additional file 1). Green fluorescence was observed after transduction in 293T cells, indicating successful virus packaging. Assessments of fluorescence intensity and cell state (Figure 1C) after transduction revealed that the best MOIs of CMV-FTH1 and NSE-FTH1 for MSCs were 15 and 10, respectively. MSCs/CMV-FTH1 and MSCs/NSE-FTH1 were constructed by transducing the recombinant lentivirus CMV-FTH1 or NSE-FTH1 into MSCs at the selected MOIs.
Figure 2|Identification of MSCs and NLCs.
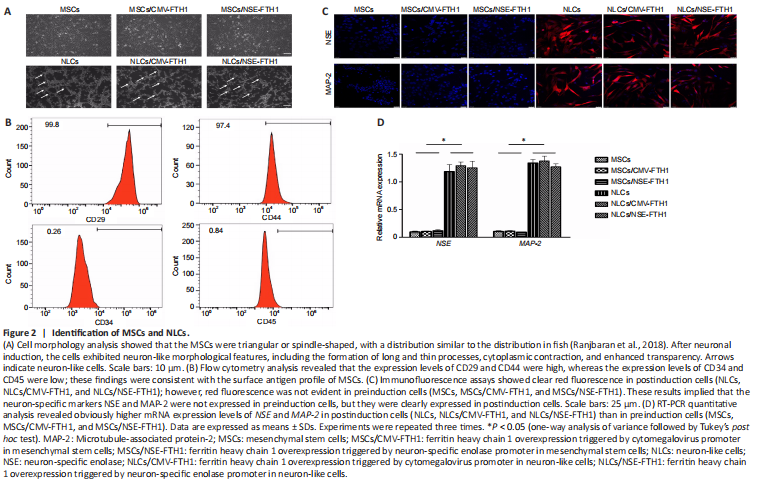
Microscopy showed that MSCs had a triangular or spindle-like morphology (Figure 2A). Flow cytometry revealed that 99.8% and 97.4% of MSCs expressed CD29 and CD44, respectively, whereas 0.26% and 0.84% of MSCs expressed CD34 and CD45, respectively. These findings were consistent with the surface antigen profile of MSCs (Figure 2B).
After neuronal induction, the cells became more transparent, and the cytoplasm contracted toward the nucleus. Additionally, most cells exhibited long and thin processes that were connected to adjacent cells. These morphological features were consistent with neuronal morphology (Figure 2A). Immunofluorescence assays showed that the neuron-specific markers NSE and MAP-2 were expressed in all three groups of cells after neuronal induction, whereas they were not expressed before neuronal induction (Figure 2C). PCR showed the mRNA levels of NSE and MAP-2 were both higher in postinduction cells (NLCs, NLCs/CMV-FTH1, and NLCs/NSE-FTH1) than in preinduction cells (Figure 2D).
Figure 3|FTH1 expression in cells before and after neuronal differentiation.
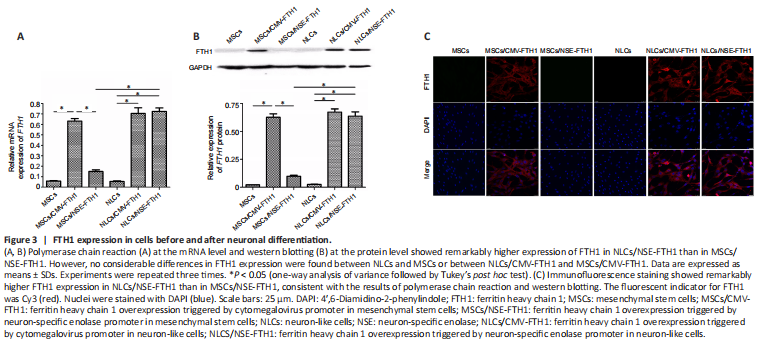
The mRNA or protein expression of FTH1 in each group of cells was determined by PCR, western blotting, or immunofluorescence staining. PCR revealed remarkably greater mRNA expression of FTH1 in NLCs/NSE-FTH1 than in MSCs/NSE-FTH1. No considerable differences were found in the mRNA expression of FTH1 between MSCs and NLCs or between MSCs/CMV-FTH1 and NLCs/CMV-FTH1 (Figure 3A). The results of western blotting and immunofluorescence staining were consistent with the results of PCR (Figure 3B and C). The above findings suggested that the NSE promoter specifically induced reporter gene expression after neuronal differentiation, whereas the CMV promoter induced constitutive reporter gene expression (i.e., regardless of neuronal differentiation).
Figure 5| In vitro MRI analysis and iron assay before and after neuronal differentiation.
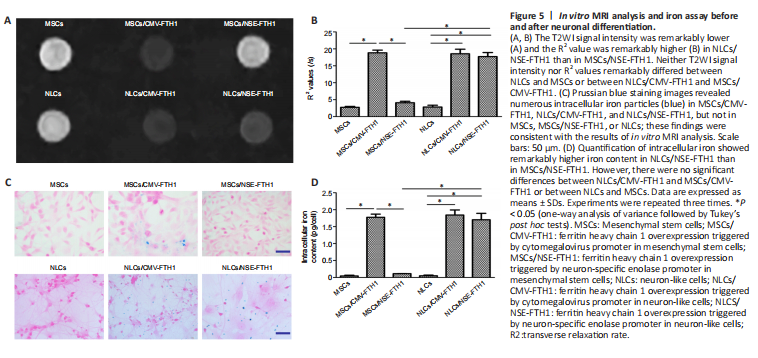
The MRI signal contrast of MSCs before and after neuronal differentiation was evaluated by T2WI and multi-echo sequences. As shown in Figure 5A and B, compared with MSCs/NSE-FTH1, NLCs/NSE-FTH1 showed remarkably decreased T2WI signal intensity and remarkably increased R2 values. However, no differences in T2WI signal intensity or R2 values were found between MSCs and NLCs or between MSCs/CMV-FTH1 and NLCs/CMV-FTH1.
The FTH1-induced accumulation of intracellular iron was qualitatively analyzed via Prussian blue staining and quantitively assayed via cellular iron measurements. Prussian blue staining revealed greater accumulation of intracellular iron particles in MSCs/CMV-FTH1, NLCs/CMV-FTH1, and NLCs/NSE-FTH1, compared with MSCs, MSCs/NSE-FTH1, and NLCs, respectively (Figure 5C). These results were consistent with the in vitro MRI findings, indicating that the NSE promoter was activated by neuronal differentiation and therefore induced FTH1 expression, which led to accumulation of intracellular iron. Quantitative analysis revealed remarkably higher intracellular iron content in postinduction cells (NLCs/NSE-FTH1) than in preinduction cells (MSCs/NSE-FTH1). No significant differences were observed between MSCs and NLCs or between MSCs/CMV-FTH1 and NLCs/CMV-FTH1 (Figure 5D).
Figure 6| In vivo validation of magnetic resonance imaging for assessment of stem cell differentiation-induced reporter gene expression.
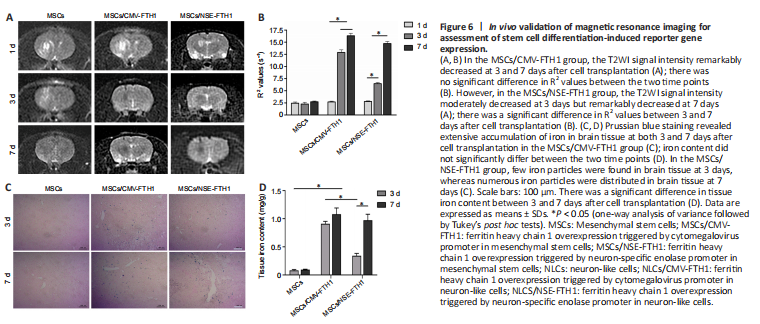
MRI examinations were performed after intracerebral transplantation of the three groups of cells. In the MSCs/CMV-FTH1 group, the T2WI signal intensity remarkably decreased (Figure 6A) at 3 and 7 days after cell transplantation, whereas the R2 values did not significantly change between the two time points (Figure 6B). However, in the MSCs/NSE-FTH1 group, the T2WI signal intensity moderately decreased at 3 days but remarkably decreased at 7 days (Figure 6A), and there was a significant difference in R2 values between 3 and 7 days after cell transplantation (Figure 6D). The difference in MRI signal between 3 and 7 days in the MSCs/NSE-FTH1 group could have resulted from differences in neuronal differentiation among the transplanted cells.
Prussian blue staining revealed numerous iron particles distributed in brain tissue at both 3 and 7 days after cell transplantation in the MSCs/CMV-FTH1 group (Figure 6C). Iron content did not significantly differ between the two time points (Figure 6D), which was consistent with the findings of rat MRI examinations. In the MSCs/NSE-FTH1 group, few iron particles were observed at 3 days, whereas numerous iron particles were detected at 7 days (Figure 6C). The tissue iron content was remarkably different between 3 and 7 days after cell transplantation (Figure 6D). These results showed that NSE promoter-driven FTH1 expression was dependent on neuronal differentiation, whereas CMV-driven reporter gene expression could not indicate whether cells had undergone differentiation.