脑损伤
-
Figure 1|Characterization of VEGF + bFGF PCL NF membranes.

The microscopic morphology of NF membranes was observed by SEM. As shown in Figure 1A, random PCL NF membranes were successfully prepared by electrospinning. VEGF and bFGF were deposited on the surface of the PCL NF membranes using electrostatic LBL self-assembly technology, and VEGF + bFGF PCL NF membranes with 5, 10, 15, and 20 layers were fabricated. The SEM results showed that all of the membranes had a clear 3D structure. The fibers on the surface of the untreated PCL NF membranes were smooth, loosely arranged, and randomly oriented. As the number of loaded layers increased, the particles were deposited continuously, the NFs came into closer contact, and the pore size and porosity decreased. SEM revealed a highly uniform and interconnected porous structure of the VEGF + bFGF NF membranes with 5 and 10 layers. In contrast, the presence of an excess amount of particles blocked the micropores of 15- and 20-layer VEGF + bFGF NF membranes, resulting in an unclear fiber structure. In addition, the NF diameter increased as the number of loaded layers increased, and the average diameters of the NFs in the 5- and 10-layer VEGF + bFGF membranes were similar to those in the PCL membrane (Figure 1B). The diameter of the NFs in the membranes with 15 and 20 layers was significantly increased (P < 0.05, 15 and 20 layers vs. PCL, 5 and 10 layers, respectively), but the differences between the 15- and 20-layer membranes was statistically insignificant.
VEGF and bFGF release by the different membranes was then analyzed using enzyme-linked immunosorbent assay. As displayed in Figure 1C and D, rapid release from all membranes was observed in the first 3 days. Between the 3rd and 10th days, VEGF and bFGF were released efficiently and steadily. All VEGF + bFGF NF membranes exhibited sustained release for > 30 days. The 5-layer membrane exhibited the fastest release and achieved the plateau phase first, followed by the 10-layer membrane. Because high porosity provided enough space for cell growth and adhesion, combined with different sustained release efficiency, we chose 10-layer VEGF + bFGF NF membranes for use in the subsequent experiments.
Figure 2|NVU model and confirmation of the identity of the cellular components.
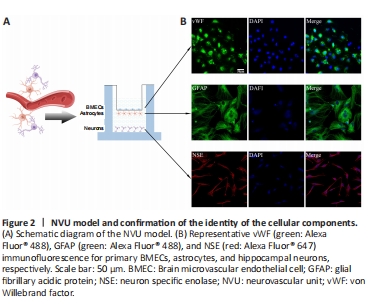
A 3D co-culture system that contained three types of primary cells was constructed to simulate the structure of NVUs in vitro (Figure 2A). vWF, GFAP, and NSE immunofluorescence assays confirmed the successful isolation of primary BMECs, astrocytes, and hippocampal neurons, respectively (Figure 2B).
Figure 3|NF membranes loaded with VEGF and bFGF promote BMEC tube formation and proliferation after OGD.
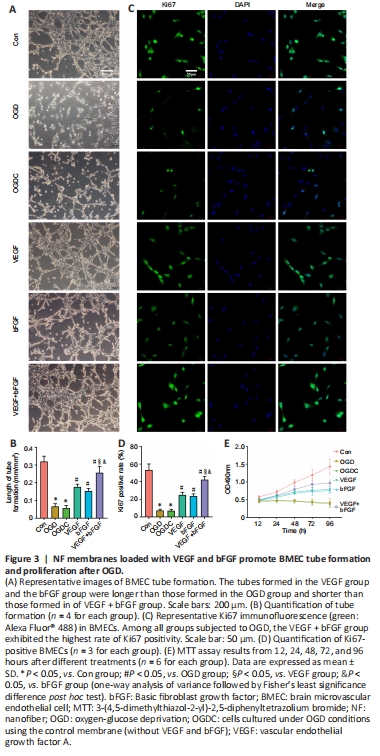
We investigated the effects of VEGF + bFGF NF membranes on BMECs subjected to OGD by tube formation assessment, Ki67 immunofluorescence staining, and MTT assay. OGD treatment inhibited tube formation by BMECs (P < 0.05, vs. Con group; Figure 3A and B) and decreased the proportion of Ki67-positive cells (P < 0.05, vs. Con group; Figure 3C and D). Similar results were observed in the OGDC group. However, the presence of VEGF or bFGF NF membranes relieved OGD-induced inhibition of tube formation (both P < 0.05, vs. OGD group). Furthermore, compared with the VEGF and bFGF groups, the VEGF + bFGF group exhibited longer tube length and higher Ki67 immunofluorescence intensity (both P < 0.05).
MTT assay was used to measure the relative number and viability of BMECs. As shown in Figure 3E, the OD value in the VEGF group was akin to that in the bFGF group, higher than those in the OGD and OGDC groups, and lower than that in the VEGF + bFGF group. Therefore, VEGF + bFGF NF membranes alleviated OGD-induced inhibition of angiogenesis and promoted BMEC proliferation.
Figure 4|NF membranes loaded with VEGF and bFGF promote neuronal growth and inhibit OGD-Induced apoptosis.
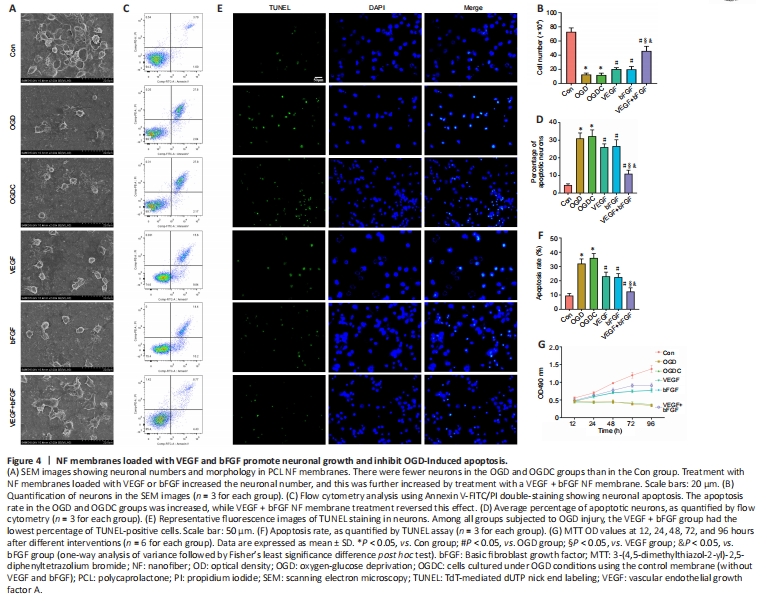
Primary hippocampal neuron number was determined by SEM. We found that there were fewer cells in the OGD and OGDC groups than in the Con group (both P < 0.05; Figure 4A and B). VEGF and bFGF NF membrane treatment distinctly elevated the cell number (both P < 0.05, vs. OGD group), and this increase was even more pronounced with VEGF + bFGF NF membrane treatment (both P < 0.05, vs. VEGF and bFGF groups).
Next, neuronal apoptosis induced by OGD was detected by flow cytometry (Figure 4C and D). The apoptosis rate in the OGD and OGDC groups was markedly increased (both P < 0.05, vs. Con group), while that in the VEGF and bFGF groups was lower than that in the OGD group (both P < 0.05). Compared with the VEGF and bFGF groups, the apoptosis rate was decreased in the VEGF + bFGF group (both P < 0.05).
Consistent with the above observation, OGD increased the percentage of TUNEL-positive cells (P < 0.05, vs. Con group; Figure 4E and F). The apoptosis rate did not differ significantly between the OGD and OGDC groups; however, treatment with VEGF and bFGF NF membranes reduced the green fluorescence intensity (both P < 0.05, vs. OGD group). Moreover, VEGF + bFGF NF membrane treatment further decreased the apoptosis rate (both P < 0.05, vs. VEGF and bFGF groups).
MTT assay was performed to quantify neuronal viability (Figure 4G). Similar to the TUNEL results, the VEGF + bFGF group had the highest OD value, followed by the VEGF and bFGF groups, while the OGD and OGDC groups had the lowest values. Collectively, these findings suggest that VEGF + bFGF NF membranes promote neuronal attachment and growth and attenuate OGD-induced apoptosis.
Figure 5|NF membranes loaded with VEGF and bFGF ameliorate OGD-induced injury to cellular components of the NVU.
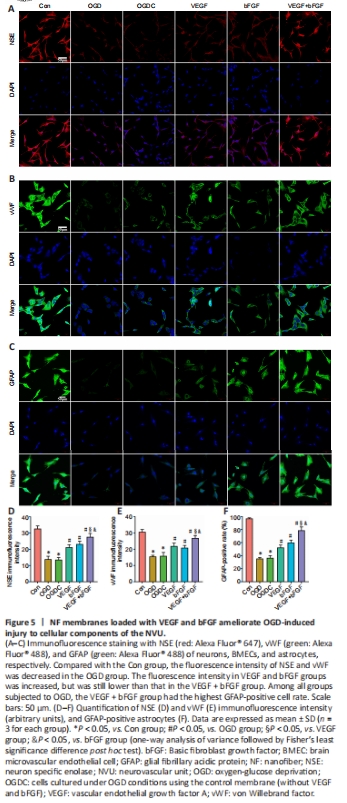
To investigate the protective effect of VEGF + bFGF NF membranes on NVUs subjected to OGD in vitro, we quantified NSE, vWF, and GFAP immunofluorescence staining in the 3D co-culture systems containing primary hippocampal neurons, BMECs, and astrocytes, respectively. The variations in NSE and vWF immunofluorescence intensity in each treatment group were basically the same (Figure 5A, B, D, and E). OGD led to a decline in fluorescence expression compared with the Con group (P < 0.05), and OGDC treatment did not improve this negative impact (P > 0.05, vs. OGD group). The level of fluorescence expression in the VEGF and bFGF groups increased, but was still significantly lower than that in the VEGF + bFGF group (both P < 0.05). Moreover, the VEGF, bFGF, and VEGF + bFGF groups demonstrated a significant increase in the number of GFAP-positive cells compared with the OGD group (all P < 0.05). The VEGF + bFGF NF membranes had the most pronounced effect (both P < 0.05, vs. VEGF and bFGF groups; Figure 5C, and F). In contrast, the OGDC group did not exhibit alleviation of the decrease in the number of GFAP-positive stained astrocytes compared with the OGD group (P > 0.05). Taken together, these findings suggest that VEGF + bFGF NF membranes helped improve cellular activity within NVUs and prevented OGD-induced fatal injury.
Figure 6|NF membranes loaded with VEGF and bFGF upregulate the expression of tight junction proteins by BMECs after OGD.
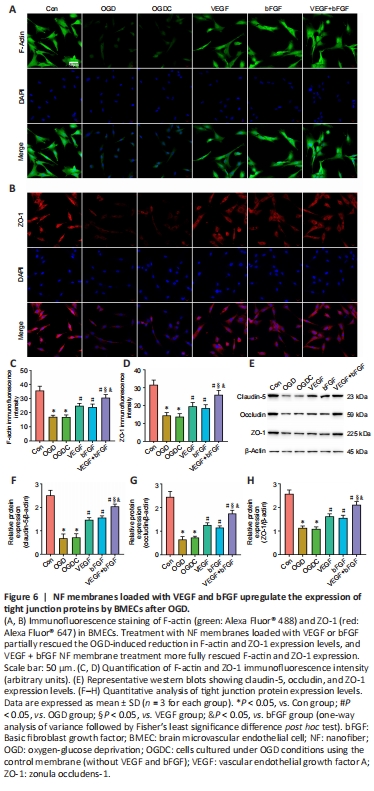
BMECs joined by tight junctions constitute the anatomic basis of the BBB, which is a vital element of the NVU (De Strooper and Karran, 2016). The cytoskeletal protein F-actin and the tight junction scaffolding protein ZO-1 were observed in BMECs via immunofluorescence staining to assess BBB disruption. F-actin and ZO-1 expression were reduced in BMECs exposed to OGD (both P < 0.05, vs. Con group; Figure 6A–D). VEGF and bFGF NF membrane treatment partly rescued the expression of both proteins (both P < 0.05, vs. OGD group), and this effect was enhanced by VEGF + bFGF NF membrane treatment (both P < 0.05, vs. VEGF and bFGF groups). To further analyze changes in the expression of tight junction proteins, such as claudin-5, occludin, and ZO-1, western blotting was performed. We found that the expression levels of all of these tight junction proteins were decreased in the OGD and OGDC groups in contrast to the Con group (all P < 0.05, Figure 6E–H), while VEGF and bFGF NF membrane treatment, especially VEGF + bFGF NF membrane treatment, significantly increased their expression levels (all P < 0.05, vs. OGD group). In conclusion, the VEGF + bFGF NF membrane improved neuron, BMEC, and astrocyte activity, repaired BBB dysfunction, and maintained the integrity of functional NVUs subjected to OGD.