神经退行性病
-
Figure 2 | NaHS improves Quin-induced neurobehavioral impairment.

As depicted in Figure 2A, the mice were subjected to intraperitoneal injections of NaHS and ML385 once daily for 3 consecutive days prior to striatal injection of Quin. ROS levels were assessed 1 day post-injection, followed by behavioral tests at 2 and 6 days post-injection. We used fluorescein isothiocyanate dye to demonstrate successful Quin injection into the striatum of mice (Figure 2B). Compared with the Sham group, the survival rate in the Quin group was 80% at 2 days after surgery and 70% in the Quin + NaHS + ML385 group 3 days after surgery. However, no deaths occurred in the Quin + NaHS group, and there was no statistically significant difference in survival rate among the groups (Figure 2C). The suspension test results demonstrated an increase in fall latency after 2 and 6 days of NaHS treatment, as compared with the Quin group (Figure 2D). Moreover, mice in the ML385 group fell more quickly than mice in the other groups at all time points. In the geotaxis reflex test, turn latency was decreased in mice treated with NaHS 2 and 6 days following Quin injection into the striatum compared with the Quin group, while mice treated with ML385 displayed significantly longer latency at both time points compared to the Quin + NaHS group (Figure 2E). The open-field test was carried out at 6 days after injury to measure motor ability. As previously reported (JousselinHosaja et al., 2003), mice injected with Quin in the striatum showed an increase in the total distance and crossing number compared with control mice. NaHS administration significantly decreased the total distance and crossing number, while treatment with ML385 reversed these effects (Figure 2F–H).
Figure 3 | NaHS improves Quin-induced histological impairment.
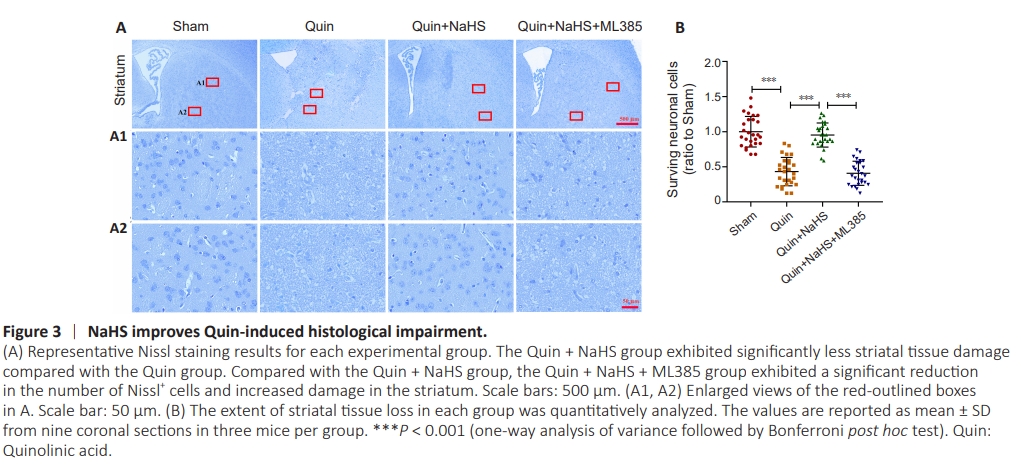
Nissl staining was applied to assess the effect of Quin injection on striatal nerve damage. The NaHS group exhibited Nissl+ cells in the striatum 6 days post-injection. Neuronal loss and morphological changes were markedly reduced by NaHS treatment (Quin + NaHS group). The ML385 group exhibited a markedly lower number of Nissl+ cells in the striatum compared with the Quin + NaHS group (Figure 3A and B).
Figure 4 | NaHS inhibits Quin-induced cell apoptosis.
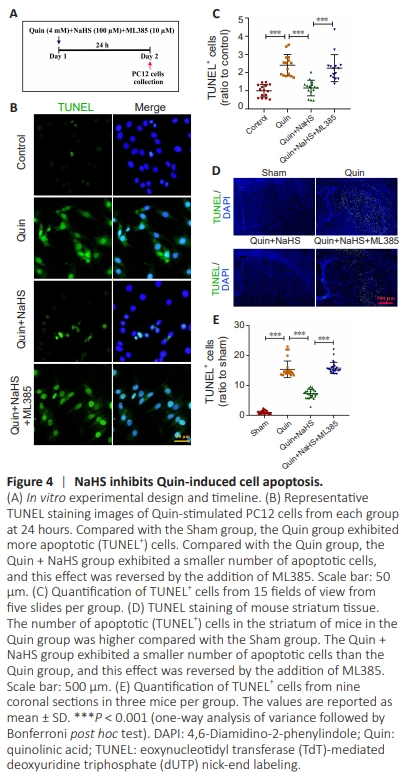
Excessive neuronal cell apoptosis is the underlying mechanism of neuronal demise in neurodegenerative disorders (Haeberlein, 2004; Peng et al., 2024; Yang et al., 2024), and Quin dramatically increases apoptosis rates (SilvaIslas et al., 2019). Thus, we examined Quin-induced cell apoptosis and the effect of NaHS treatment in PC12 cells. The cells were incubated with Quin, NaHS, and ML385 for 24 hours, as depicted in Figure 4A, followed by cell collection for subsequent analysis. TUNEL staining demonstrated a significant reduction in PC12 cell apoptosis compared with control cells following 24 hours of NaHS treatment, and this protective effect was reversed by ML385 (Figure 4B and C). Next, we assessed Quin-induced apoptosis and the effect of NaHS in the mouse striatum. TUNEL staining showed that NaHS treatment markedly reduced cell apoptosis, while treatment with ML385 negated this effect (Figure 4D and E). The potential toxicity of Quin to peripheral organs in mice was assessed 6 days after striatal injection. HE staining did not show any indications of toxicity (Additional Figure 2). The Sham group, which was treated with the ML385 mother liquor solvent DMSO and the diluted ML385 solvent corn oil (Sham + DMSO + corn oil) did not show morphological damage, indicating that the ML385 solvents did not have harmful effects on the mice (Additional Figure 3); therefore, the Sham + DMSO + corn oil group was not examined further.
Figure 5 | Treatment with NaHS inhibits the dysregulation of neuroplasticity induced by Quin.

Studies indicate that Quin can induce synaptic damage in primary human neurons (Latif-Hernandez et al., 2016; Bansal et al., 2019; Bhat et al., 2021; Cogo et al., 2021). Our immunofluorescence analysis showed a marked rise in expression of the key neuroplasticity-related marker PSD95, as well as the neuronal marker NeuN, in the Quin + NaHS group compared with Quin group. Treatment with ML385 reversed these effects (Figure 5A and B). NaHS treatment significantly restored the Quin-induced reduction in the expression levels of a range of regulatory proteins related to neuroplasticity (PSD95, SYT1, and Syn) in mice, as assessed by Western blot, whereas treatment with ML385 resulted in decreased PSD95, SYT1, and Syn expression levels (Figure 5C).
Figure 6 | NaHS reduces oxidative stress by suppressing Nrf2.
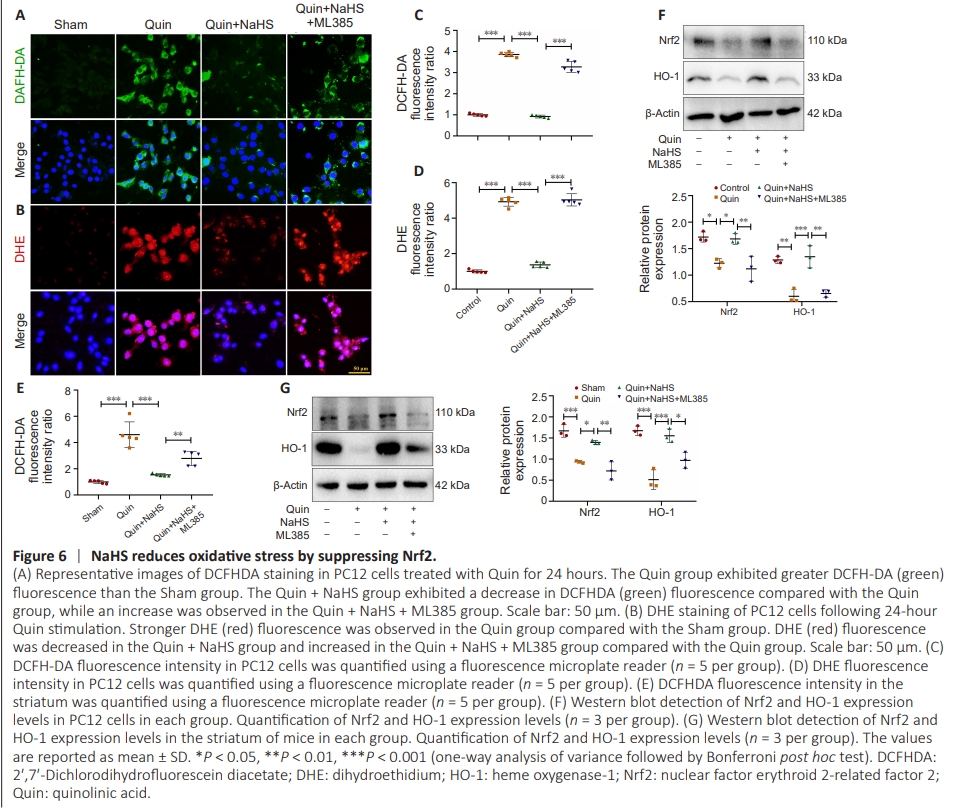
Quin stimulates the N-methyl-D-aspartate receptor, which increases Ca2+ influx and promotes ROS production (Silva-Islas et al., 2022), while H2S generally functions to prevent ROS accumulation (Chen et al., 2020), and the Nrf2/HO-1 pathway is a pivotal factor in combating oxidative damage (Wang et al., 2020; Chen, 2022). Therefore, we next asked whether NaHS alleviates Quin-induced oxidative stress through Nrf2 signaling. Intracellular ROS levels exhibit a positive correlation with oxidative stress levels (Gorrini et al., 2013). DCFHDA staining is primarily employed for the detection of intracellular ROS levels (McMurray et al., 2016; Cao et al., 2021). Fluorescence staining of PC12 cells showed that NaHS treatment decreased the amount of DCFHDA+ neurons by 67.7%, whereas DCFHDA+ neurons were upregulated 2.92-fold in the Quin + NaHS + ML385 group, compared with the Quin group (Figure 6A and Additional Figure 4A). Next, DHE staining was performed to detect O2? – levels (Fernandes et al., 2007; Mondejar-Parre?o et al., 2019). Compared with the Quin group, the Quin + NaHS group exhibited a 59.7% decrease in DHE fluorescence density, whereas the DHE fluorescence density was increased 2.36-fold in the Quin + NaHS + ML385 group (Figure 6B and Additional Figure 4B). The PC12 cell DCFHDA and DHE staining results wereconfirmed by fluorescence measurement using a microplate reader (Figure 6C and D). Similarly, using a fluorescence microplate reader to detect DCFHDA fluorescence intensity in the striatum of mice, we found that NaHS treatment decreased the number of DCFHDA+ cells by 66.69%, whereas the number of DCFHDA+ cells was increased 1.81-fold in the Quin + NaHS + ML385 group, compared with the Quin group (Figure 6E). NaHS treatment resulted in significantly higher expression levels of Nrf2 and its downstream effector HO-1, while Nrf2 and HO-1 expression levels were slightly downregulated in the Quin + NaHS + ML385 group, compared with the Quin group, as determined by western blot (Figure 6F and G). These results are in agreement with the findings from both the in vitro and in vivo experiments described above.
Figure 7 | NaHS regulates mitochondrial function in Quin-stimulated PC12 cells by suppressing Nrf2.
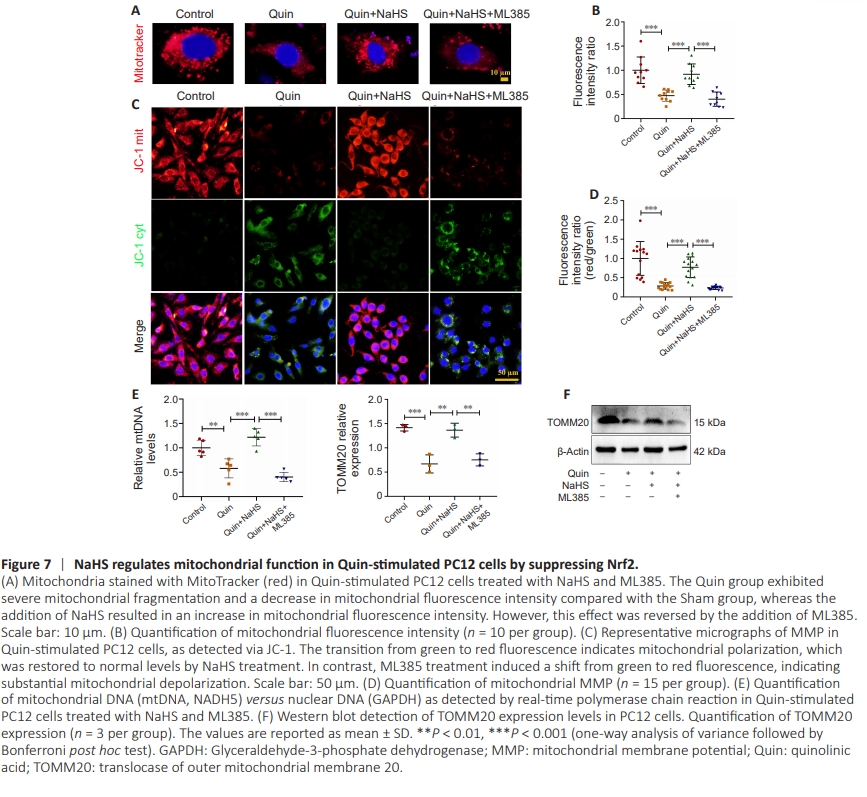
The excitotoxic cascade triggered by Quin induces striatal damage and is closely connected to mitochondrial damage because of oxidative stress (Blomgren and Hagberg, 2006; Fuhrmann and Brüne, 2017). There is evidence indicating that Quin promotes mitochondrial crista swelling, spherical morphology, and fragmentation, which in turn affect mitochondrial function (Luis-García et al., 2017). Therefore, we next assessed the structural integrity of mitochondria in cells treated with Quin. Mitochondria in the Quin + NaHS group exhibited an increase in fluorescence intensity, whereas PC12 cells treated with NaHS and ML385 showed severe mitochondrial fragmentation and a decrease in fluorescence intensity, compared with the Quin + NaHS group (Figure 7A and B). Then, we assessed MMP via JC-1, with a transitionfrom green to red fluorescence indicating mitochondrial polarization. NaHS significantly restored the MMP, while mitochondria were severely depolarized after NaHS and ML385 treatment, compared with the Quin + NaHS group (Figure 7C and D). Consistent with these findings, real-time PCR analysis revealed that cells in the Quin + NaHS group contained greater levels of mtDNA than cells in the Quin group. In contrast, mtDNA levels were markedly reduced in the Quin + NaHS + ML385 group compared with the Quin group (Figure 7E). Furthermore, expression of the mitochondrial outer membrane protein TOMM20 was upregulated in the Quin + NaHS group and downregulated in the Quin + NaHS + ML385 group compared with the Quin group, as determined by western blot analysis (Figure 7F).