神经退行性病
-
Figure 2 | Unilateral 6-OHDA lesion induces motor impairment and progressive loss of dopaminergic neurons in caudoputamen.
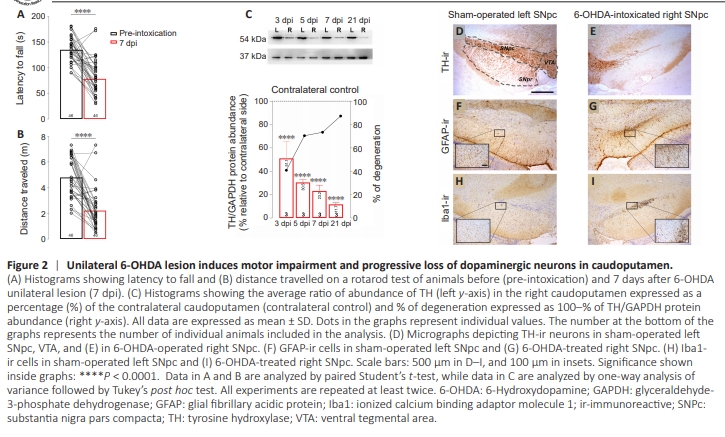
The animals showed marked impairment of motor skills. Because of the unilateral rSNpc lesion, the animals had difficulty using the contralateral left limbs. The animals also showed a significant reduction in latency to fall (t = 7.96, df = 40, P < 0.0001; Figure 2A) and the distance traveled (t = 7.30, df = 54, P < 0.0001; Figure 2B) compared with their baseline performance in the rotarod test assessed 1 day before lesion was induced (Figure 2A and B). The neurodegeneration specific to certain regions, resulting from the injection of 6-OHDA into the right SNpc, was further confirmed at the protein level. The loss of dopaminergic neurons and terminals in the ipsilateral CPu was indirectly demonstrated through immunoblotting of tyrosine hydroxylase (TH), the enzyme that serves as a rate-limiting factor in the catecholamine biosynthesis pathway (Figure 2C). The trend of decreasing TH protein abundance in the rCPu was evident at all tested time points: 3 dpi (t = 7.56, df = 4, P < 0.0001), 5 dpi (t = 8.16, df = 4, P < 0.0001), 7 dpi (t = 7.24, df = 4, P < 0.0001), and 21 dpi (t = 8.69, df = 4, P < 0.0001; Figure 2C, right axis). This indicates a progressive loss of dopaminergic neurons. The loss of dopaminergic neurons was further confirmedd t h ro u g h T H i m m u n o h i sto c h e m i st r y co n d u c te d at the caudoputamen/midbrain level. A decrease in TH immunoreactivity was evident in the rSNpc and the right substantia nigra pars reticulata, when compared with their corresponding left counterparts. Notably, the ventral tegmental area (VTA) appeared to be spared bilaterally (Figure 2D and E). Additionally, unilateral enhancements in glial fibrillary acidic protein immunostaining (Figure 2F and G) and Iba1 immunostaining (Figure 2H and I) were observed at the border between the rSNpc and the right substantia nigra pars reticulata. These findings are suggestive of reactive gliosis. However, the overall immunoreactive patterns did not indicate the presence of highly reactive glial states (Additional Figure 2).
Figure 3 | Effect of prolonged iTBS on motor behavior and neuroinflammation of 6-OHDA lesioned rats.

Seven days after 6-OHDA injection, TH protein abundance in the rCPu had decreased by approximately 70% compared with the contralateral side. Based on this observation and the timeline outlined in Figure 1B, this time point was selected as the starting point for the initiation of iTBS stimulation. Briefly, animals with 6-OHDA lesions were allowed to recover for 7 days before being subjected to either iTBS stimulation (iTBS group) or sham stimulation (sham group) for 7 or 21 consecutive days. At the end of the 21-day stimulation period, motor abilities were assessed using the rotarod test. Animals in the iTBS group exhibited significant improvements in rotarod performance, demonstrating both enhanced endurance on the rotating rod (t = 5.16, df = 19, P = 0.0012; Figure 3A) and increased distance traveled (t = 3.41, df = 19, P = 0.014; Figure 3A), compared with the sham group. There were no significant differences in the expression levels of IL1β (Mann–Whitney U = 2, P = 0.4) and TNF-α (Mann–Whitney U = 2, P = 0.8) between the lCPu and rCPu in the sham group (Figure 3B). However, in the iTBS group, a significant decrease in IL-1β levels was observed in the rCPu (MannWhitney U = 0, P = 0.028), whereas no significant change in TNF-α expression was observed (Mann–Whitney U = 7, P = 0.88). With regards to microglial (Figure 3C–F) and astroglial (Figure 3G–J) responses in iTBS animals, the ionized calcium binding adaptor molecule 1 (Iba-1) and glial fibrillary acidic protein-immunoreactive (GFAP-ir) patterns in the right SNpc were notably less pronounced compared with those in rSNpc in the sham group. Furthermore, these patterns were only slightly different from the non-lesioned lSNpc (Figure 3C and G), indicating a substantially lower level of neuroinflammation and glial response following iTBS stimulation.
Figure 5 | Effect of prolonged iTBS on adenosine-mediated signaling in crude synaptosomal fraction of caudoputamen of 6-OHDA lesioned rats.

We further performed immunoblot analysis of adenosine receptors and adenosine-metabolizing enzymes. The analyses were performed in crude CPu membrane (P2) and cytosolic fractions (Figure 5). The abundance of target proteins in rCPu was expressed as a percentage of the protein abundance in lCPu in each animal. The abundance of eN/CD73 increased by approximately 50% and 25% after 7- and 21-day sham stimulation, respectively, although the increase at the mRNA level was observed only after 21-day stimulation. iTBS stimulation was able to decrease eN/CD73 protein abundance to a level comparable to the contralateral lCPu after 7-day stimulation (t = 3.25, df = 8, P = 0.0063). Accordingly, after 21-day stimulation, eN/CD73 protein abundances were also comparable in two hemispheres (t = 1.09, df = 8, P = 0.3050; Figure 5A). With regard to adenosine-degrading enzyme adenosine deaminase (ADA), there was a trend toward a modest increase in adenosine deaminase 1 (ADA1) protein abundance in iTBSsh after 7-day and 21-day sham stimulation (Figure 5B). Consistent with qRT-PCR data, iTBS reduced expression of ADA1 protein after 21-day stimulation to a level comparable to the contralateral CPu (t = 3.32, df = 8, P = 0.0105). Therefore, with regard to adenosine metabolizing enzymes, it appears that iTBS counteracted the impact of 6-OHDA lesion by restoring protein expression of eN/CD73 and ADA1 to the levels comparable to the contralateral CPu. Next, we determined the functional consequences of altered gene and protein expression of ectonucleotidases after 6-OHDA lesion and iTBS stimulation. Specifically, we determined therate of AMP hydrolysis which can be attributed to eN/CD73. Conditions for optimal enzyme activity were determined in separate experiments and are shown in Additional Figure 1. With regard to eN/CD73, more than 2-fold higher activity was detected in rCPu (100.20 ± 3.11 nmol Pi/mg/min) compared with lCPu (50.68 ± 2.98 nmol Pi/mg/min, t = 11.58, df = 27, P < 0.0001) after 7-day sham stimulation, while the hemispheric difference was less pronounce after 21-day sham, but still increased in rCPu [lCPu, 72.59 ± 3.51 nmol Pi/mg/min; rCPu, 95.66 ± 2.28 nmol Pi/mg/min; t = 5.71, df = 28, P < 0.0001). The 7-day iTBS stimulation failed to produce any effect, resulting in the activity of eN/CD73 remaining unchanged in both the rCPu (61.45 ± 3.88 nmol Pi/mg/min) and the lCPu (100.30 ± 3.69 nmol Pi/mg/min, t = 6.98, df = 28, P < 0.0001) compared with the corresponding sham group. Following a 21-day stimulation, the activity of eN/CD73 in the rCPu (100.8 ± 2.01 nmol Pi/mg/min) became comparable to that in the contralateral lCPu (94.16 ± 2.52 nmol Pi/mg/min, t = 1.99, df = 27, P = 0.0591), effectively erasing the differences between the two hemispheres (Figure 5E). Consistent with the qRT-PCR data, 6-OHDA induced a decrease in A1R protein abundance by approximately 20% in the rCPu (Figure 5C) and an increase in A2AR protein abundance by approximately 30% (Figure 5D) after both 7-day and 21-day sham stimulation. Following iTBS stimulation, there was a consistent increase in A1R expression at the protein level in the rCPu compared with the rCPu of sham-stimulated animals after both 7-day (t = 2.91, df = 8, P = 0.0271) and 21-day (t = 3.47, df = 8, P = 0.0084) stimulation. Furthermore, consistent with the expression analysis, A2AR protein decreased in the rCPu after both 7-day (t = 3.60, df = 8, P = 0.007) and 21-day (t = 3.73, df = 8, P = 0.0057) stimulation, becoming comparable to the contralateral hemisphere. Finally, the cellular allocation of eN/CD73, A1R, and A2AR was determined using immunochemistry (Figure 5). The immunoreactivity corresponding to eN/CD73 was evenly distributed throughout the striatal matrix in both the iTBSsh group (Figure 5F) and the iTBS group (Figure 5G), with striosomes completely devoid of immunostaining (Figure 5F and G). As for adenosine receptors, both A1R (Figure 5H and I) and A2AR (Figure 5J and K) were predominantly expressed in striosomes, while the matrix remained poorly stained. Notably, there were striking differences in the immunostaining patterns between the sham and iTBS groups.