神经退行性病
-
Figure 1 | HDAC6 knockdown enhances lysosomal acidification in SH-SY5Y cells.
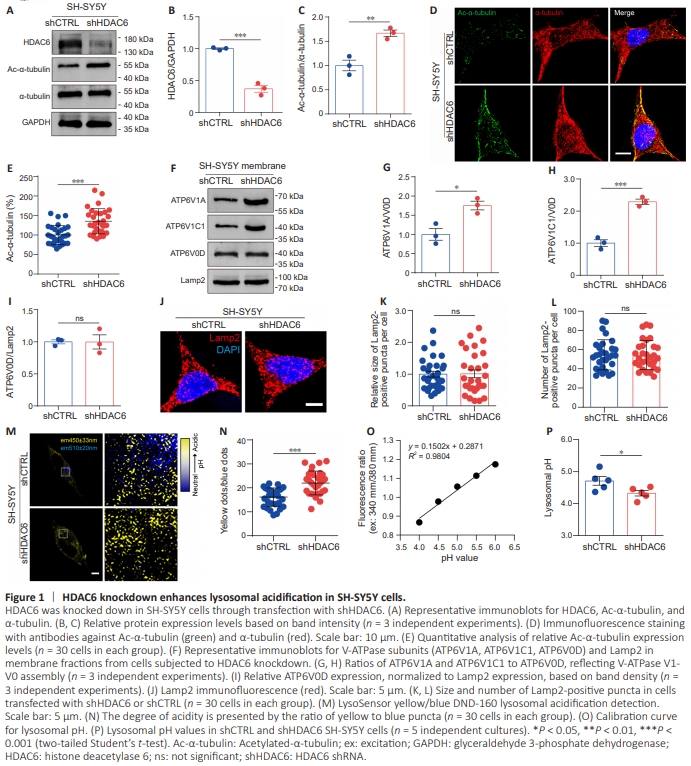

We used an HDAC6-specific shRNA to knock down HDAC6 expression in human SH-SY5Y cells; a nonspecific shRNA was used as a control. The knockdown efficiency was validated by western blotting (Figure 1A and B). We observed a marked increase in acetylated-α-tubulin (Ac-α-tubulin) expression, but not total α-tubulin expression, in the HDAC6 knockdown (shHDAC6) cells compared with the control (shCTRL) cells (Figure 1A, C–E). A recent study by Tang et al. (2021) showed that microtubule acetylation can affect lysosomal acidification by regulating V-ATPase assembly on lysosomes. To determine whether the effect of HDAC6 inhibition on V-ATPase assembly influences lysosomal acidification, we examined V-ATPase V1- V0 holoenzyme levels and measured lysosomal pH values. To determine the expression level of the V-ATPase V1-V0 holoenzyme, we isolated the membrane fractions of shCTRL and shHDAC6 cells and assessed the V-ATPase V1 subunit content of the lysosomal membrane. The membraneembedded V-ATPase V0 subunit V0D (ATP6V0D) and the lysosomal marker Lamp2 were detected as loading controls. V-ATPase V1-V0 holoenzyme levels were represented by the abundance of the membrane-associated V1 subunits V1A (ATP6V1A) and V1C1 (ATP6V1C1) relative to V0D. Western blot analysis showed that the levels of ATP6V1A and ATP6V1C1 in shHDAC6 cells were significantly higher than those in shCTRL cells, while ATP6V0D levels were comparable between the two cell groups (Figure 1F–I), demonstrating that HDAC6 inhibition promoted V-ATPase assembly on lysosomes. As V-ATPase assembly is key to lysosomal acidification, we next measured changes in lysosomal pH in response to HDAC6 inhibition using the LysoSensor Yellow/Blue DND-160 probe, which emits blue fluorescence in less acidic vesicles and yellow fluorescence in more acidic vesicles (Klionsky et al., 2016). HDAC6 inhibition did not alter lysosome size or quantity (Figure 1J–L). LysoSensor probe analysis demonstrated that shHDAC6 cells exhibited stronger yellow fluorescence and weaker blue fluorescence compared with shCTRL cells (Figure 1M and N). Comparing the ratio of yellow to blue fluorescence to a pH standard curve showed that the absolute pH value was 4.7 in shCTRL cells, while it was 4.3 in shHDAC6 cells (Figure 1O and P). These results suggest that HDAC6 inhibition enhances lysosomal acidification.
Figure 2 | VPA enhances lysosomal acidification in SH-SY5Y cells.

Next, we tested the effect of VPA on α-tubulin deacetylation by western blot and immunofluorescence analysis. Ac-αtubulin expression was significantly higher in VPA-treated SHSY5Y cells (VPA) compared with vehicle control cells (VEH) (Figure 2A–D). To determine whether inhibiting HDAC6 with VPA, similar to inhibiting HDAC6 with shHDAC6, reduces V-ATPase assembly and lysosomal acidification, we treated SH-SY5Y cells with 1 mM VPA for 24 hours and isolated the membrane fraction. Vehicle-treated SH-SY5Y cells were used as a control. ATP6V1A and ATP6V1C1 were present at significantly higher levels in the membrane fraction of VPAtreated cells than in VEH-treated cells after normalization to the loading control ATP6V0D (Figure 2E–H). In addition, VPA-treated cells stained with LysoSensor Yellow/Blue DND160 exhibited stronger yellow fluorescence and weaker blue fluorescence than VEH-treated cells (Figure 2I and J). This observation demonstrated a decrease in lysosomal pH in response to VPA treatment. Measuring absolute lysosomal pH values yielded similar results (Figure 2K). Taken together, these data suggest that VPA enhances lysosomal acidification by increasing V-ATPase assembly, which is consistent with the HDAC6 knockdown results.
Figure 3 | VPA promotes lysosomal acidification in an in vitro model of Alzheimer’s disease.
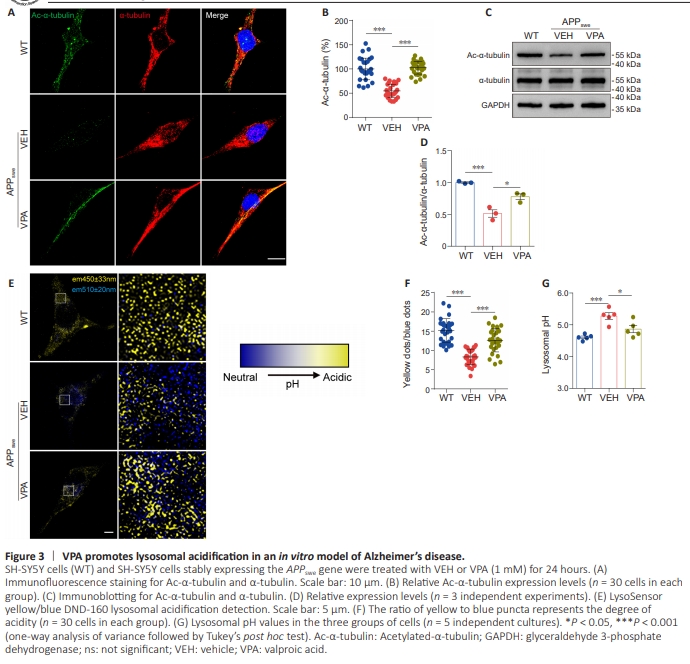
Lysosomes in patients with AD exhibit significant alkalization, which impairs autophagy, leading to neuronal death. Given that VPA enhanced lysosomal acidification by regulating microtubule acetylation and V-ATPase assembly, we next asked whether treatment with VPA could restore lysosomal homeostasis in an in vitro AD models We measured the lysosomal pH in SH-SY5Y cells stably expressing the APPswe gene (APPswe cells) that were treated with VPA (1 mM, 24 hours) or left untreated. As expected, VPA increased Ac-α-tubulin levels but not total α-tubulin levels in APPswe cells (Figure 3A– D). LysoSensor probe analysis (Figure 3E and F) showed that, compared with the VEH APPswe cells, the VPA-treated APPswe cells exhibited stronger yellow fluorescence and weaker blue fluorescence. In addition, VPA treatment essentially restored absolute lysosomal pH values to levels similar to those seen in WT cells (Figure 3G), suggesting that VPA treatment restored lysosomal alkalization in an in vitro AD model.
Figure 4 | VPA activates autophagy and promotes lysosomal function in an in vitro model of Alzheimer’s disease.
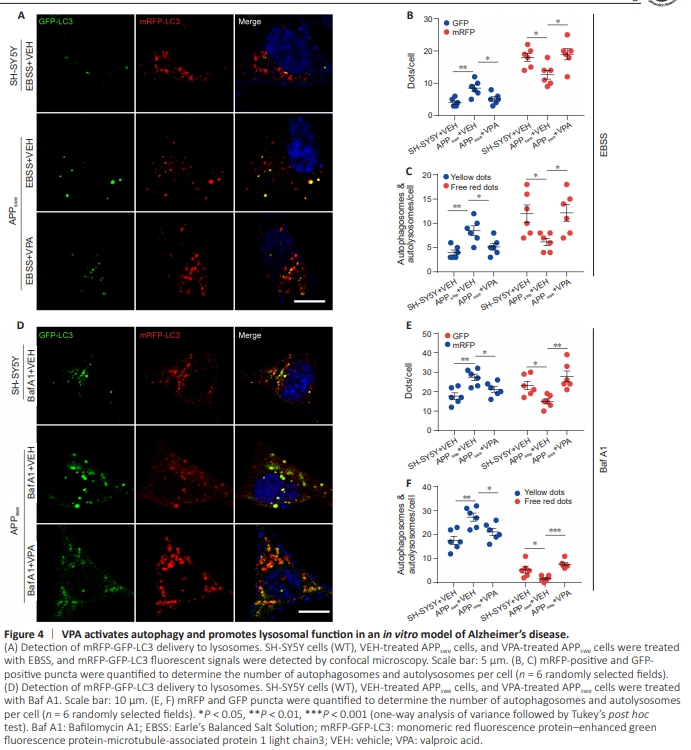
Figure 5 | VPA promotes lysosomal function in an in vitro model of Alzheimer’s disease.
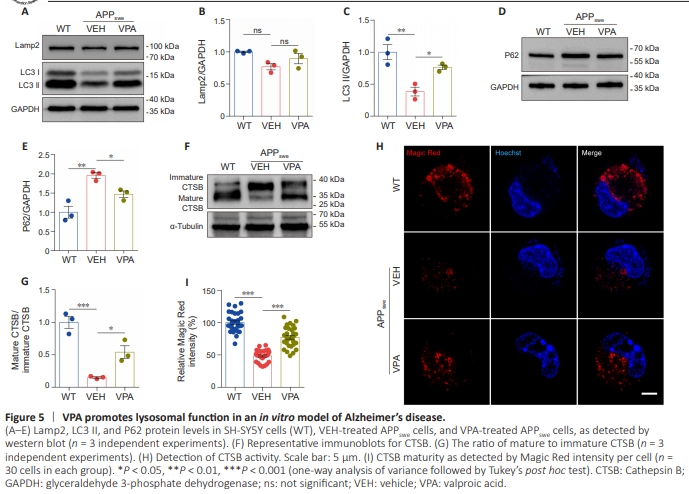
To investigate the effect of VPA on autophagic flux in an in vitro AD models, we infected APPswe cells with adenovirus encoding mRFP-GFP-LC3 for 24 hours and detected GFP and mRFP colocalization, which indicated autophagosomes and less acidified autolysosomes; red signals represented fully acidified autolysosomes (Lee et al., 2019). Compared with the WT cells, the number of yellow puncta increased significantly in APPswe cells. In addition, the number of red puncta decreased markedly when autophagy was induced by treatment with EBSS or inhibited by treatment with Baf A1. We also observed a decrease in the number of yellow punctaand an increase in the number of red puncta in APPswe cells treated with both VPA and EBSS (Figure 4A–C) or VPA and Baf A1 (Figure 4D–F). Confirming these findings, VPA treatment increased LC3 II expression and decreased P62 expression compared with VEH treatment; however, there was no significant change in the levels of the lysosomal marker Lamp2 between the two groups (Figure 5A–E). These findings suggest that VPA enhanced autophagic flux in an in vitro AD model. The hydrolase activity of proteases present in lysosomes, such as CTSB, is highly controlled by the luminal pH (Johnson et al., 2016). The CTSB precursor pro-CTSB is usually inactive, until it is exposed to an acidic pH environment, at which point it is proteolytically processed and glycosylated to form the mature protein (Porter et al., 2013; Hook et al., 2022). Intriguingly, we observed a striking increase in the ratio of mature CTSB to pro-CTSB, as determined by western blot (Figure 5F and G), and enhanced CTSB activity, as detected by Magic Red assay (Figure 5H and I), in VPA-treated APPswe cells compared with VEH-treated APPswe cells, while Lamp2 expression levels did not change. These results suggest that VPA facilitates lysosomal hydrolase maturation.
Figure 6 | VPA restores autophagy and alleviates Aβ burden in APP/PS1 mice.
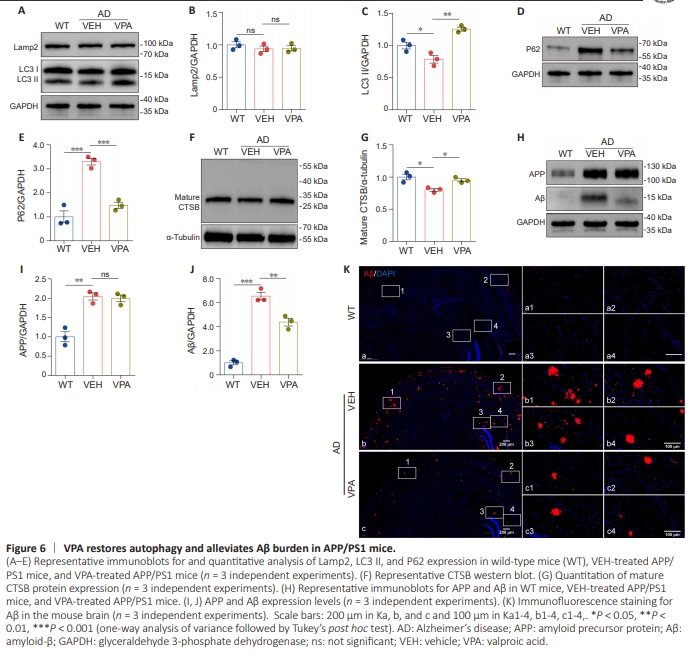
Next, we examined the effect of VPA on autophagy in a mouse model of AD by delivering VPA to transgenic APP/ PS1 mice via intraperitoneal injection. Similar to the in vitro results, VPA treatment elevated the LC3 II level (Figure 6A and C) and reduced the P62 level (Figure 6D and E) in vivo. In addition, compared with the VEH group, the expression level of mature CTSB notebly increased in the VPA-treated APP/PS1 mice (Figure 6F and G), while the level of Lamp2 remained unchanged (Figure 6A and B). These findings suggest that VPA treatment accelerated autophagy in APP/PS1 mice. Given that autophagy is critical for degrading Aβ aggregates, we next explored whether VPA treatment would alleviate the Aβ burden in AD model mice. To test this, we used immunofluorescence and western blotting to detect Aβ plaques in the brains of APP/PS1 mice treated with VPA or left untreated. Consistent with the increase in autophagy that we observed earlier, compared with the VEH group, the VPA group exhibited a significant decreased in Aβ levels, but no change in APP levels, as determined by western blot assay (Figure 6H–K). The immunofluorescence assay showed that fewer Aβ puncta formed in the VPA group than in the VEH group. These results suggest that VPA may reduce Aβ deposition by enhancing autophagy in APP/PS1 mice.