脑损伤
-
Figure 1 | Single-cell atlas of hippocampus in cardiac arrest and resuscitation pig model.
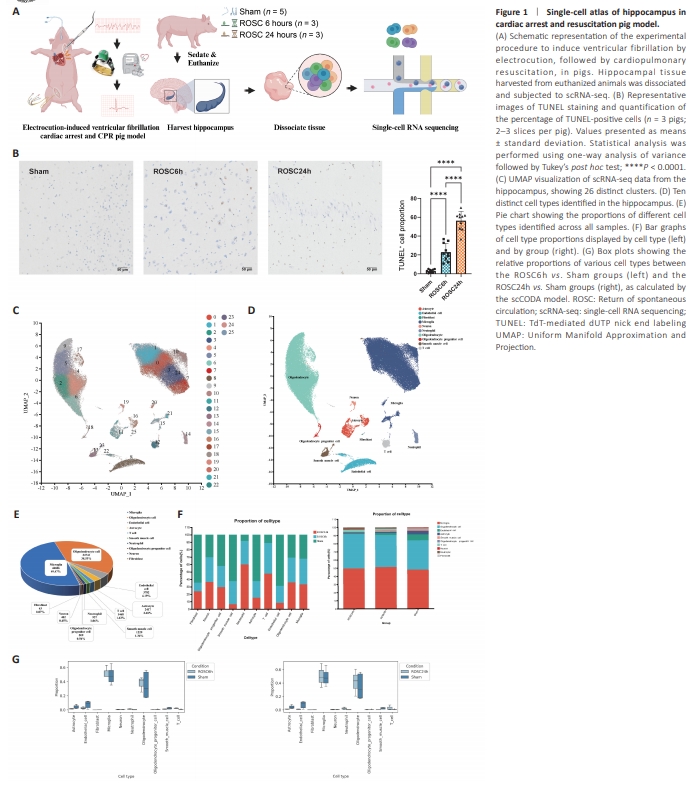
We assessed the CA-induced pathological changes in the pig hippocampus using TUNEL staining (Figure 1B). The results showed significantly more TUNEL-positive cells in both the ROSC6h and ROSC24h groups (both P < 0.0001 vs. Sham group), with a significantly greater increase in ROSC24h than in ROSC6h (P < 0.0001), suggesting that CA induces progressive damage to the hippocampus.Utilizing the 10x Genomics platform to perform high-throughput scRNAseq, we examined the transcriptional profiles of hippocampal cells in the Sham and CA model groups. After processing, we generated 90,176 singlecell gene expression profiles: 39,665 from the Sham group, 27,997 from the ROSC6h group, and 22,514 from the ROSC24h group (Additional Table 2). We employed UMAP to visualize all sample data in two dimensions for cellular heterogeneity analysis, identifying 26 clusters (Figure 1C; Becht et al., 2018). Leveraging cell type-specific markers from a pig single-cell atlases (https://dreamapp.biomed.au.dk/pigatlas/), as well as classical markers of known cell types from the Cell Taxonomy database (https://ngdc.cncb.ac.cn/ celltaxonomy/), we annotated the single-cell data, identifying 10 distinct cell types (Additional Table 3; Wang et al., 2022; Jiang et al., 2023). These included four glial classes (microglia, oligodendrocytes, oligodendrocyte progenitor cells (OPCs), and astrocytes), two leukocyte classes (neutrophils and T cells), three vascular classes (endothelial cells, smooth muscle cells and fibroblasts), and neurons (Figure 1D). Notably, among the identified cell types, microglia and oligodendrocytes were the most prevalent, accounting for 49.47% and 38.53% of the total cells, respectively (Figure 1E).The distribution and relative abundance of the different cell categories across the ROSC6h, ROSC24h, and Sham groups are described in Figure 1F, G and Additional Tables 2–4. The two-proportion Z-test showed that, compared with the Sham group, the proportions of astrocytes, endothelial cells, smooth muscle cells, fibroblasts, oligodendrocytes, and OPCs were significantly reduced in both the ROSC6h and ROSC24h groups (all P < 0.0001). By contrast, the proportions of microglia, neutrophils, and T cells were significantly higher in the ROSC6h and ROSC24h groups than in the Sham group (all P < 0.0001). Notably, the ROSC24h group showed lower proportions of astrocytes (P < 0.0001), endothelial cells (P < 0.0001), microglia (P < 0.001), neutrophils (P < 0.0001), oligodendrocytes (P < 0.0001), smooth muscle cells (P < 0.0001), and T cells (P < 0.01) compared with the ROSC6h group. No significant differences in neuronal proportions were observed among the three groups (Additional Table 4). To minimize potential biases inherent in raw proportion comparisons, we further applied the scCODA model for analysis (Buttner et al., 2021), which revealed a higher proportion of T cells in the ROSC6h group than in the Sham group. Additionally, the ROSC24h group had lower proportions of astrocytes, endothelial cells, and smooth muscle cells, and a higher proportion of neutrophils, compared with the Sham group (Figure 1G and Additional Table 5).
Figure 3 | Characterization of microglia subclusters after cardiac arrest.
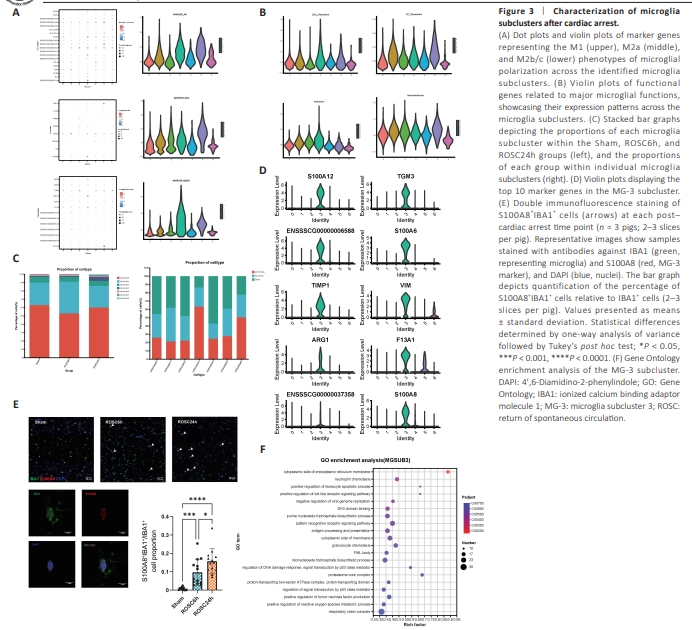
To further explore the diversity of microglia following CA, we re-clustered 44606 microglia from all groups into seven subclusters, designated MG-0 to MG-6 (Figure 2D). We utilized a dot plot to illustrate the expression of marker genes in each subcluster (Figure 2E). Microglial polarization into M1 or M2 phenotypes post stroke is well documented (Lan et al., 2017; You et al., 2024a), but whether this occurs after global cerebral ischemia-reperfusion following CA remains unclear. Initially, we sought to examine the expression of three sets of classical polarization markers corresponding to the M1, M2a, and M2b/c phenotypes. However, our data revealed that only a few of these were highly expressed in some subclusters, with co-expression of genes from different polarization groups within the same subcluster (Figure 3A; Lan et al., 2017). The representative genes of microglial polarization are listed in Additional Table 7. This suggested that the simple binary classification into M1 and M2 may not be adequate. Therefore, we sought to elucidate the post-ROSC heterogeneity of microglia by exploring the phenotypic scenarios of each subcluster through examination of the expression of functional genes that regulate chemokines, interleukins, and anti-inflammatory and neurotrophic molecules (e.g., neurotrophins, growth factors, and neuropeptides) (Figure 3B and Additional Table 8). GO enrichment analysis of DEGs for each subpopulation and scoring of gene sets representing classical microglial functions led to the identification of an intriguing subpopulation (Additional Figure 1). A distinct microglial subcluster is associated with neuroinflammation following cardiac arrest One subcluster of microglia, MG-3, was significantly increased in the ROSC6h group compared with that in the Sham group, showing a further increase in the ROSC24h group (Figure 3C). The top marker genes for MG-3 included S100A6, S100A8, S100A9, S100A12, TIMP117, and ARG1 (Figure 3D), which were confirmed by immunofluorescence staining analysis (Figure 3E). Additionally, MG-3 exhibited significant gene expression of M1/ M2 polarization markers, chemokines, and interleukins, suggesting that it represents activated microglia. GO pathway enrichment for MG-3 revealed key processes in energy metabolism, including respiratory chain and ATPase complexes, alongside immune regulation pathways such as tumor necrosis factor production and neutrophil chemotaxis, while highlighting the role of p53 in DNA damage response. Other notable areas involves reactive oxygen species regulation, viral response control, and leukocyte apoptosis. These pathways illustrate the diverse roles of MG-3 in immune response and cellular maintenance (Figure 3F).
Figure 4 | Characteristics of hippocampal oligodendrocytes and OPC following cardiac arrest.

Oligodendrocytes, crucial for axonal integrity and myelination in the central nervous system (CNS), are particularly vulnerable to ischemic damage, which can lead to demyelination, axonal instability, and long-term neurological dysfunction (Huang et al., 2023). Thus, we sought to explore functional changes in hippocampal oligodendrocytes at the single-cell level followingCA. We identified expression of the classical oligodendrocyte markers MBP, MOG, and OLIG1, as well as previously identified swine markers, including PLP, TMEFF2, and TF (Figure 4A). Next, an analysis of differential gene expression in hippocampal oligodendrocytes among the Sham and CA model groups revealed the following notable DEGs: SGCZ, FKBP5, MOBP, ISG15, ISG12(A), and IFI6 in the ROSC6h group; and ENSSSCG00000057738, H3- 3A, ND2, RIMS2, ISG12(A), and IFI6 in the ROSC24h group (Figure 4B and Additional Table 6). This analysis further revealed decreased expression levels of oligodendrocyte and myelin integrity markers, such as MOBP, at both 6 and 24 hours post CA, with MBP and MOG showing reductions at 24 hours. Western blot analysis of hippocampal tissues demonstrated that, compared with the Sham group, MBP levels were significantly decreased at 6 hours post CA (P < 0.001), showing a further decline at 24 hours post CA (P < 0.01; Figure 4C). Immunofluorescence staining validated that the reduction in hippocampal MBP expression was sustained at 6 and 24 hours post CA (Figure 4D). Pathway analysis revealed both shared and unique biological processes at 6 and 24 hours. Common pathways included myelin sheath formation, cell body maintenance, and chaperone-mediated protein folding. At 6 hours, there were exclusive pathways related to phosphorus metabolism, synaptic functions, and cellular response to organic substances, among others focused on cell motility, projection, and morphogenesis. By 24 hours, pathways shifted to include protein complex assembly regulation, protein localization, and various aspects of protein stability, along with unique cellular rebuilding processes such as endocytosis and cytokinesis regulation (Figure 4E).To further investigate the post-CA diversity of oligodendrocytes, we reclustered 34743 oligodendrocytes from the three groups into six subclusters, designated OLG-0 to OLG-5 (Figure 4F). A volcano plot illustrating the top DEGs for each subcluster showed that the genes with the greatest changes in OLG-0 were PALM2AKAP2, EGR1, and MX1. GO enrichment analysis of OLG-0 showed the involvement of key processes, including cell movement, adhesion, and metabolic pathways involving lipids and steroids, highlighting its roles in immune function activities involving antigen presentation via MHC class I. In OLG-1, the top DEGs were HMGCS1, GRIN2B, and FCHSD2, with pathway enrichment analysis highlighting cell movement regulation, actin cytoskeleton organization, and cell adhesion as key processes. OLG-1 was also enriched for molecular functions involved in GTPase signaling and biosynthesis of lipids and steroids, essential for cellular metabolism and structural integrity. In OLG2, the top DEGs were ISG15, ISG12(A), and IFI6, with involvement in pathways related to immune responses, including antigen processing and presentation, particularly via MHC class I. Key pathways also involved responses to external stimuli and biotic threats, regulation of viral genome replication, and defense mechanisms against viruses. In OLG-3, the top DEGs were FOS, EGR1, and JUNB, with pathway enrichment related to oligodendrocyte responses to various stimuli, including oxygen-containing compounds, extracellular factors, organic substances, and cytokines. These pathways involved numerous binding activities, including sequence-specific DNA binding by RNA polymerase II, double-stranded DNA binding, and transcription factor binding, all within cis-regulatory regions. Additionally, there was involvement in the regulation of cell death processes, including both positive and negative regulation of apoptosis and programmed cell death. Other notable functions included ubiquitin-like protein ligase and transferase activities. In OLG4, the top DEGs were CST3, CALCR, and C1QB, with GO enrichment results highlighting processes involving actin polymerization, myeloid and lymphocyte differentiation, and immune response via MHC protein complexes. It also showed regulation of leukocyte activities and involvement of endoplasmic reticulum components. In OLG-5, the top DEGs were ISG15, STAT1, and SLC6A20, with pathway enrichment analysis highlighting its involvement in metabolic regulation, immune responses, and stress reactions. Key processes included the regulation of nitrogen and protein metabolism, antigen processing and presentation via MHC class I, and defense responses to various stimuli, particularly viruses. These findings suggested a multifaceted role for oligodendrocytes in neuroimmune interactions and environmental response within the CNS (Figure 4G and H).
Figure 5 | Single-cell RNA sequencing analysis of T cells, neutrophils, and endothelial cells in the hippocampus following cardiac arrest.

Following brain injury, inflammation-mediated BBB damage triggers the recruitment of peripheral immune cells, which directly interact with resident brain cells or release immune mediators that shape the immune niche and influence recovery (Cunningham et al., 2022). We observed the expression of classical T-cell markers CD3D and CD3E, and previously identified swine markers, including GNLY, CTSW, and SKAP1 (Figure 5A). Differential gene expression analysis of T cells revealed S100A1, HSPA6, and APOE as key DEGs in the ROSC6h group and ENSSSCG00000018063, ND2, and ND3 in the ROSC24h group (Figure 5B and Additional Table 6). At 6 hours post–CA, T cells were found to be involved in pathways related to leukocyte activation, protein polymerization, cell death regulation, translation, and actin dynamics. Key processes included regulation of lymphocyte activation, cell proliferation, protein complex assembly, unfolded protein binding, and response to cytokines. By 24 hours, the focus shifted to pathways regulating mononuclear cell proliferation, immune response, leukocyte and T-cell chemotaxis, and proliferation, along with RNA polymerase II-specific transcription factor binding. Mitochondrial electron transport, cellular respiration, and antigen receptor-mediated signaling were also prominent. Common to both time points was the generation of precursor metabolites and energy (Figure 5C). A previous study has observed T-cell infiltration in the brain parenchyma following CA (Smida et al., 2021). In contrast, we detected neutrophil infiltration, a novel finding not previously reported, as evidenced by expression of the classical T-cell marker CSF3R (Figure 5D). Western blot analysis of hippocampal tissue showed a significant increase in the neutrophil marker protein MPO in the ROSC6h group (P < 0.05), with a further increasein the ROSC24h group (P < 0.05), compared with that in the Sham group (Figure 5E). Additionally, immunofluorescence staining of hippocampal tissue confirmed neutrophil infiltration into the brain parenchyma of CA model pigs that increased as ROSC progressed (Figure 5F). These findings provided clear evidence of neutrophil infiltration following CA. Next, we conducted a differential gene expression analysis of hippocampal neutrophils among the Sham and CA model groups, revealing CXCL10, RETN, and S100A9 as key DEGs in the ROSC6h group and S100A9, S100A12, and TIMP1 in the ROSC24h group (Figure 5G and Additional Table 6). At 6 and 24 hours post CA, neutrophils shared common pathways, including regulation of cell adhesion, interspecies interaction between organisms, response to external biotic stimulus, and regulation of immune system processes. Unique pathways that were expressed at 6 hours involved the regulation of nitrogen compound metabolism, mononuclear cell proliferation, various immune responses, and T cell-related processes. At 24 hours, the unique pathways were associated with stress response regulation, signal transduction, nitric oxide biosynthesis, cell death, apoptotic processes, and innate immune responses, highlighting a shift towards stress and death mechanisms at the later time point (Figure 5H). Endothelial dysfunction following cardiac arrest We identified 3782 endothelial cells, which are crucial to the vascular lineage of the BBB and regulation of cerebral blood flow, originating from the inner walls of blood vessels. We observed expression of the classical endothelial cell markers CLDN5, PECAM1, and VWF, alongside swine-specific endothelial cell markers, including CYYR1 and ADGRF5 (Figure 5I). Differential gene expression analysis of endothelial cells among the Sham and CA model groups identified CXCL10, CXCL9, and GBP1 as key DEGs in the ROSC6h group and ENSSSCG00000032591, ENSSSCG00000057738, and MT1A in the ROSC24h group (Figure 5J and Additional Table 6). Additionally, at both time points following CA, there were reduced expression levels of tight junction protein 1 and occludin in endothelial cells. Additionally, the ROSC6h group showed decreased expression of claudin 5 in endothelial cells, indicating significant dysfunction in cerebral vascular endothelial cells and a notable increase in paracellular permeability following CA. Western blot analysis of hippocampal tissue confirmed the significant reduction in claudin 5 expression in the CA groups (P < 0.05) compared with that in the Sham group (Figure 5K). At 6 hours post–CA, endothelial cells exhibited pathway activity related to the regulation of cellular protein catabolic processes, proteolysis, cell adhesion, and endothelial cell migration, with a notable response to interferon-gamma and alpha, and regulation of signal transduction by p53. Unique pathways included cytoplasmic ribonucleoprotein granules, aerobic respiration, and proteasome core complex involvement. By 24 hours, the focus shifted towards biosynthetic and metabolic processes, specifically ribonucleoside triphosphate and purine nucleoside triphosphate metabolism, cellular component biogenesis, and regulation of vasculature development. Endothelial cells also exhibited increased nucleoside-triphosphatase regulator activity, integrin binding, and small GTPase-mediated signal transduction, alongside the presence of ribosomal subunits and components of the endoplasmic reticulum membrane (Figure 5L).
Figure 6 | Enhanced intercellular communication drives neuroinflammatory responses following cardiac arrest.
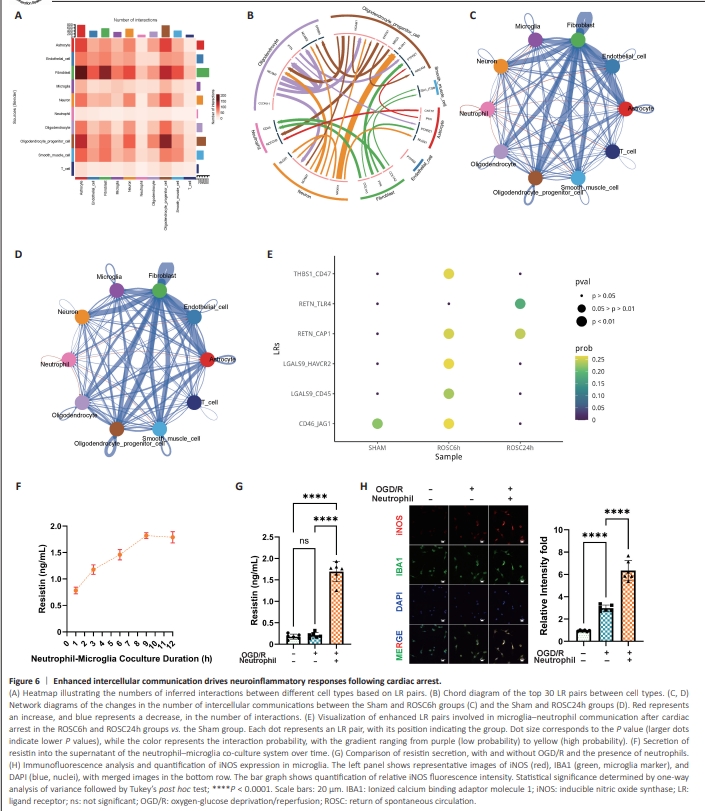
The post-CA neuroinflammatory response is dependent on complex interactions between resident brain cells and bone marrow-derived immune cells that occur through molecular adhesion on adjacent cell surfaces or the ECM, as well as the release of chemical signaling molecules. Next, we conducted cell communication analysis, using ligand–receptor interactions to infer intercellular communication within the hippocampus and to identify CA-related changes. To simulate the potential early intercellular regulatory relationships following CA, this analysis included all cells. The results indicated interactions among various cell types (Figure 6A). For instance, microglia were observed to regulate neutrophil recruitment by secreting chemokines (e.g., C–C motif chemokine ligand 8 [CCL5] and [CCL23]) of the CCL pathway, while endothelial cells modulated the adhesion of microglia and T cells by secreting ICAM1 and ICAM2 of the ICAM pathway (Additional Table 9). The chord diagram shown in Figure 6B illustrates the 30 most significant ligand–receptor pairs. In the ROSC6h group, we observed an increase in microglia–neutrophil communication, along with enhanced interactions between neutrophils and other cells, namely endothelial cells, astrocytes, T cells, smooth muscle cells, OPCs, and oligodendrocytes, compared with the Sham group (Figure 6C and Additional Table 10). At 24 hours post–CA, there were further increases in communication between neutrophils and endothelial cells, astrocytes, smooth muscle cells, and oligodendrocytes (Figure 6D and Additional Table 10). Microglia–neutrophil communication plays a critical role in neuroinflammation, leading to increased recruitment and activity of neutrophils in the brain parenchyma while simultaneously activating microglia (Kim et al., 2020). Our cell communication analysis further indicated that, post CA, neutrophils likely interact with microglia by releasing resistin, a ligand that binds to microglial receptors. Compared with the Sham group, this interaction was significantly stronger in both the ROSC6h and ROSC24h groups (Figure 6E and Additional Table 10). To verify the communication between neutrophils and microglia, we simulated post-CA interactions in an in vitro model comprising co-culture of LPS-activated neutrophils and OGD and reoxygenation (OGD/R)-treated BV2 microglial cells. First, neutrophils were activated with LPS and co-cultured with microglia under normoxic conditions. Using ELISA, we detected a time-dependent increase in resistin concentration in the co-culture supernatant that peaked at 9 hours, which was used to determine the optimal co-culture duration (Figure 6F). When the microglia underwent OGD followed by co-culture with LPS-activated neutrophils during the reoxygenation phase, they did not independently secrete resistin into the supernatant. However, resistin levels in the supernatant of the co-culture system were significantly higher than those in the OGD/R-treated microglia alone (P < 0.0001) or the control group, which consisted of microglia maintained under normoxic conditions without OGD/R treatment or neutrophil co-culture (P < 0.0001; Figure 6G). To further assess the polarization status of the microglia, we performed immunofluorescence staining to evaluate the levels of inducible nitric oxide synthase (iNOS). OGD/ R-treated microglia co-cultured with neutrophils exhibited significantly higher iNOS levels than OGD/R-treated microglia cultured alone (P < 0.0001), indicating a shift toward a pro-inflammatory phenotype (Figure 6H). These results confirmed that neutrophils communicate with microglia via resistin, driving microglial polarization and promoting neuroinflammation.