视神经损伤
-
Figure 1 | Transplantation of RPCs, with and without M-sEVs, preserves visual function and protects photoreceptors from apoptosis in RCS rats.
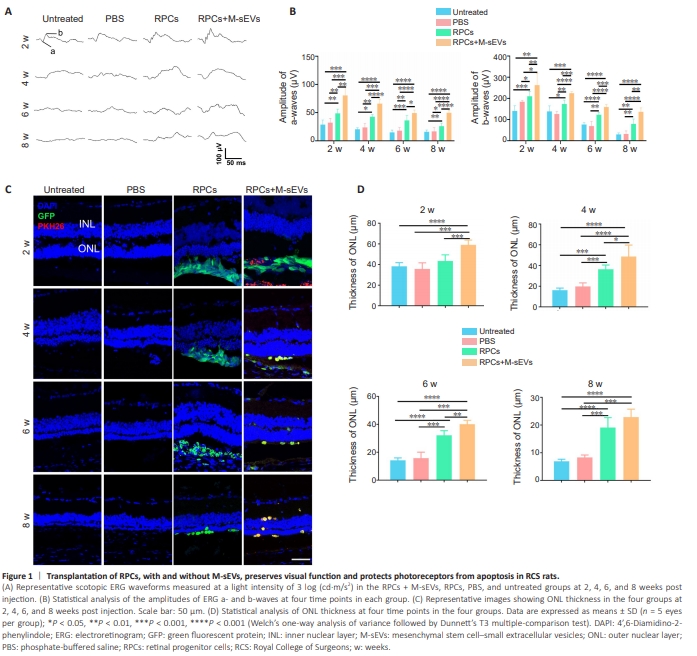
To isolate sEVs, we harvested MSCs from human bone marrow samples (Additional Figure 1B). These MSCs were positively identified by fluorescence-activated cell sorting (FACS) as expressing CD90, CD73, and CD105, while lacking expression of CD34, CD45, and HLA-DR (Additional Figure 1C). Additionally, the MSCs demonstrated multi-lineage differentiation potential, encompassing cartilage, adipogenic, and osteogenic lineages (Additional Figure 1D). The isolation of M-sEVs was achieved using differential centrifugation (Additional Figure 1E). These M-sEVs exhibited a distinctive cup-shaped membrane vesicle structure under transmission electron microscopy (Additional Figure 1F), with a particle size range of 30 to 150 nm as determined by nanoparticle tracking analysis (Additional Figure 1G). Furthermore, the M-sEVs tested positive for the markers CD63, CD9, and HSP70 (Additional Figure 1H). RPCs were also collected (Additional Figure 2A and B) and identified as expressing the neural stem cell markers SOX2, PAX6, and Nestin, while lacking expression of GFAP (Additional Figure 2C–G). To track the grafted cells and sEVs, most (97.2%) of the RPCs were labeled with EGFP via a lentiviral reporter vector (Additional Figure 2H and I), while the M-sEVs were stained with PKH26 dye. To investigate whether M-sEVs can potentiate the therapeutic effects of RPCs in RD model rats, we injected RPCs and M-sEVs (RPCs + M-sEVs) into the subretinal space of RCS rats and conducted scotopic ERG tests at various time points (Figure 1A). Both the RPCs + M-sEVs and RPCs-only groups exhibited increased amplitudes of a- and b-waves compared with the PBS control and untreated groups at 2, 4, 6, and 8 weeks post-injection. Notably, the RPCs + M-sEVs group had significantly higher amplitudes of a- and b-waves than the RPCs group (P < 0.05), particularly at 2 weeks post-transplantation, with this beneficial effect persisting for up to 8 weeks (Figure 1B). Furthermore, our analysis of oscillatory potential waves showed that the amplitudes of these waves were higher in both the RPCs and RPCs + M-sEVs groups compared with the PBS and untreated groups, with the RPCs + M-sEVs group exhibiting significantly higher wave amplitudes than the RPCs group (P < 0.01), at 2 weeks postinjection (Additional Figure 3A and B). These findings suggested that M-sEVs enhance the preservation of inner retinal function. RCS rats reportedly exhibit retinal pigment epithelial cell dysfunction due to mutations in the Mertk gene that lead to photoreceptor cell apoptosisand subsequent decreased thickness of the ONL in the retina (Cuenca et al., 2005). Therefore, we investigated the protective effects of RPCs + M-sEVs on the ONL, which revealed that treatment with either RPCs + M-sEVs or RPCs supported preservation of the ONL thickness compared with PBS or no treatment, across all time points examined. Notably, the ONL in the RPCs + M-sEVs group remained significantly thicker than that in the RPCsonly group (P < 0.05), with this protective effect persisting for up to 6 weeks post-injection (Figure 1C and D). Collectively, these findings suggested that the combined administration of M-sEVs with RPCs significantly enhance the therapeutic effect in the RD model.
Figure 2 | Co-transplantation of RPCs and M-sEVs reduces the apoptosis of retinal cells and transplanted RPCs.
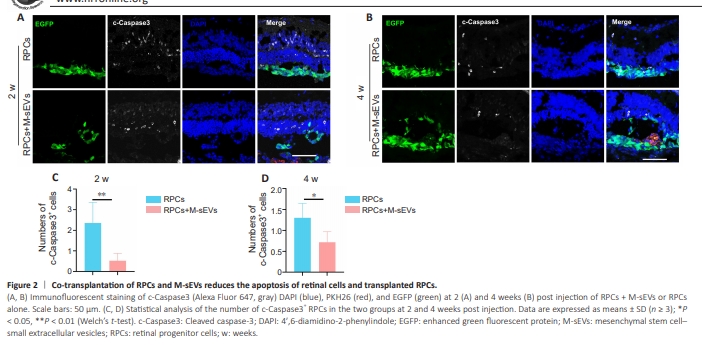
o investigate the underlying therapeutic mechanism of M-sEVs, we examined their effects on retinal cell apoptosis and the survival of transplanted RPCs in RCS rats. Immunofluorescence staining of apoptotic cells labeled with cleaved caspase-3 was performed on retinal sections. As shown in Figure 2A, B, and Additional Figure 4A, the number of cleaved caspase-3+ RPCs was lower in the RPCs + M-sEVs group than in the RPCs group at both 2 and 4 weeks postinjection, suggesting that M-sEVs enhance the survival of transplanted RPCs. Statistical analysis of the immunofluorescence staining results confirmed that this beneficial effect persisted for up to 4 weeks post-injection (P < 0.05; Figure 2C and D). Furthermore, for retinal cells, the number of cleaved caspase-3+ cells was lower in the RPCs + M-sEVs group than in the RPCs group, indicating that M-sEVs also promote the survival of host retinal cells. Collectively, these findings indicated that M-sEVs promote the survival of both retinal cells and transplanted RPCs at 2 and 4 weeks post-injection.
Figure 3 | Microglial suppression of RCS rats mediated by co-transplantation of RPCs with M-sEVs.
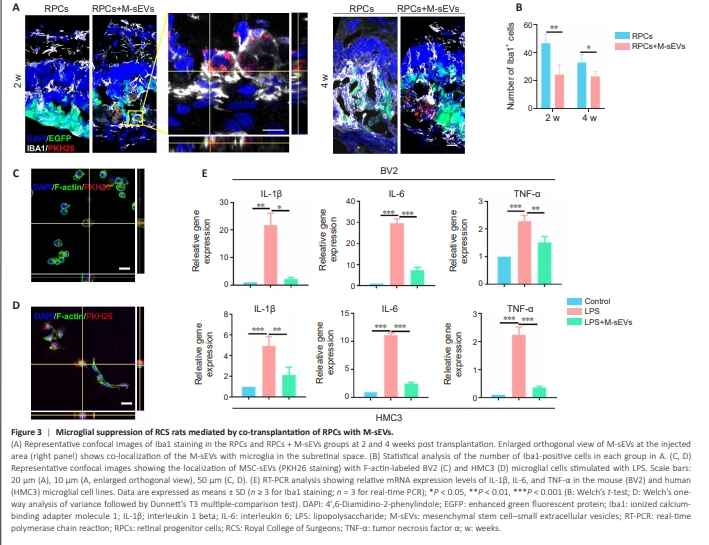
To elucidate the mechanism through which M-sEVs improve the survival of transplanted RPCs, we assessed microglial activity in RCS rats. Microglial activation is a key contributing factor to the progressive deterioration of the RD microenvironment, with degenerative-stage microglia inhibiting the survival and function of RPCs (Ma et al., 2021; Wang and Cepko, 2022). We observed that microglia internalized M-sEVs at 2 weeks post injection (Figure 3A; also see enlarged image on the right). Compared with the RPCs group, the number of Iba1+ microglia in the RPCs + M-sEVs group was significantly reduced at both 2 and 4 weeks post transplantation (P < 0.05; Figure 3A and B).To confirm these findings in vitro, BV2 and HMC3 microglial cells were activated using LPS and subsequently co-cultured with PKH26-labeled M-sEVs for 6 hours. The results showed that PKH26-labeled sEVs were co-localized with BV2 cells, and were mainly found in the cytoplasm (Figure 3C). We also found that LPS stimulation led to significantly upregulated mRNA levels of pro-inflammatory factors (P < 0.05) in BV2 cells, which was reversed by M-sEVs treatment (Figure 3E, upper panel). Labeled M-sEVs were also colocalized with LPS-stimulated HMC3 cells (Figure 3D), with similar M-sEVmediated reductions in mRNA levels of pro-inflammatory factors (Figure 3E, lower panel). These findings indicated that M-sEVs exert an inhibitory effect on neuroinflammation by suppressing activation of both human- and mousederived microglial cell lines. In summary, our findings thus far demonstrated that M-sEVs enhance the survival of RPCs by mitigating microglial activation in RD model rats, suggesting the therapeutic potential of sEVs in the treatment of retinal degenerative diseases.
Figure 4 | Migration of RPCs with and without M-sEVs.
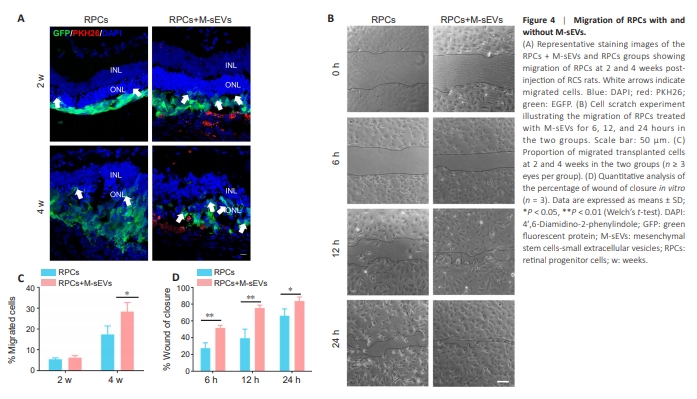
In addition to regulating the microenvironment, we unexpectedly discovered that M-sEVs influenced the distribution and disappearance of grafted RPCs. Post injection, RPCs in the co-transplantation group migrated to the ONL and inner nuclear layer (INL) of the retina at 4 and 6 weeks. Even at 8 weeks, we observed a small number of cells migrating to the retinal ganglion cell layer (GCL) (Figure 4A and Additional Figure 4B). However, quantification of the migrated cells did not reveal a statistically significant difference in the rate of cell migration between the RPCs + M-sEVs and RPCs groups at 2 weeks post injection (Figure 4C). From 4 to 8 weeks post injection, the migration rates in both groups increased, with a higher number of migrated RPCs observed in the cotransplantation group (Figure 4A, C, and Additional Figure 4B and C). These findings suggested that M-sEVs enhance the migration of RPCs in RCS rats. To further investigate this phenomenon, we conducted a scratch wound assay in vitro. The results revealed that the percentage of wound closure was higher in the RPCs + M-sEVs group than in the RPCs-only control group at 6, 12, and 24 hours post scratch (Figure 4B and D). This outperformance by the RPCs + M-sEVs group at each time point demonstrated that M-sEVs effectively promote the migration of RPCs.
Figure 5 | Cell differentiation of transplanted RPCs with and without M-sEVs at 4 weeks post-injection.
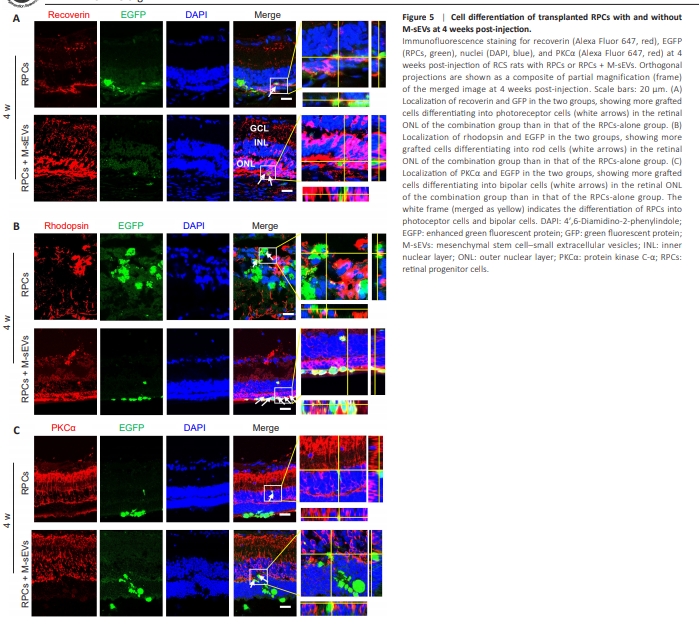
To track the fate of transplanted RPCs, we performed immunofluorescence staining using a variety of cell type-specific antibodies in retinal tissues exhibiting degenerative changes. Four weeks post transplantation, we observed that the grafted RPCs in the RPCs + M-sEVs group expressed recoverin and rhodopsin (Figure 5A and B). This finding suggested that a greater number of grafted cells differentiated into photoreceptor cells within the retinal ONL in the presence of M-sEVs. Notably, this differentiation into photoreceptors was infrequently observed in the RPCs-alone group. Next, we evaluated the differentiation of grafted RPCs into bipolar cells within the INL. Our findings revealed that the RPCs co-transplanted with M-sEVs expressed protein kinase C alpha (PKCα) (Figure 5C). However, within the GCL, only a limited number of EGFP+ grafted RPCs were observed, and these cells did not co-localize with the ganglion cell marker Brn3a. These results suggested that co-transplantation with M-sEVs promotes the differentiation of RPCs into photoreceptors and bipolar cells within the ONL and INL of the retina, respectively.
Figure 6 | M-sEVs facilitate RPC differentiation in vitro.
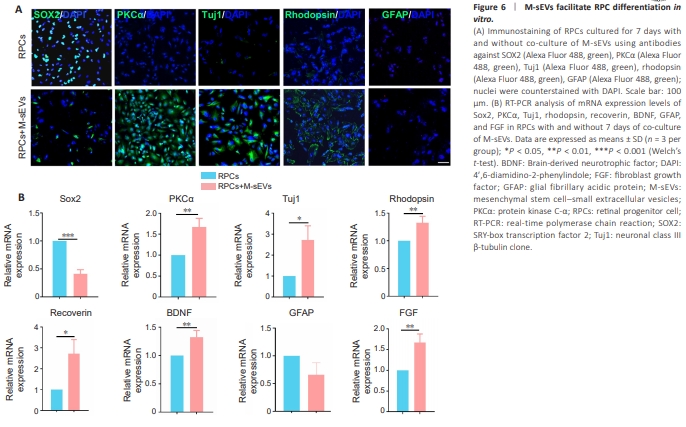
To further examine M-sEV-facilitated differentiation of RPCs, we conducted in vitro experiments in which RPCs were cultured with or without M-sEVs for 7 days. Immunostaining findings confirmed that the expression of SOX2 was significantly lower (P < 0.001) in RPCs co-cultured with M-sEVs. Conversely, immunostaining of antibodies against PKCα (indicative of bipolar cells, P < 0.01), Tuj1 (indicative of retinal ganglion cells, P < 0.05), recoverin (P < 0.01), and rhodopsin (P < 0.05) were significantly higher in RPCs co-cultured with M-sEVs than in RPCs cultured alone (Figure 6A). Consistently, relative mRNA expression analysis showed notable elevations in the levels of PKCα, Tuj1, rhodopsin, recoverin, fibroblast growth factor (FGF), and brain-derived neurotrophic factor (BDNF) in the M-sEVs co-culture group (Figure 6B). Notably, there was no significant change in GFAP expression, consistent with the immunostaining findings. Overall, our results strongly suggested that M-sEVs effectively promote the differentiation of RPCs into specialized retinal cell types, including photoreceptors and bipolar cells, both in vitro and in vivo.