脊髓损伤
-
Figure 1 | Influence of Pten gene deletion on mouse NSCs in vitro.
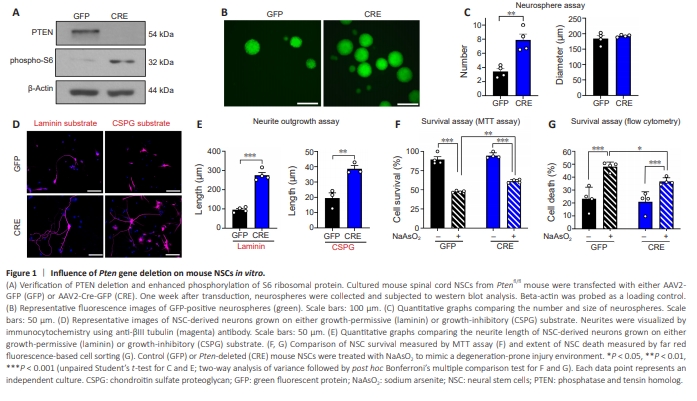
Previous studies have demonstrated that manipulating PTEN/mTOR pathway permits certain populations of CNS neurons to initiate robust regenerative growth following injury (Park et al., 2008; Liu et al., 2010; Zukor et al., 2013). We sought to understand the influence of Pten deletion on the capacity of NSCs to grow neurites and survive in a degeneration-prone environment. Cultured spinal cord NSCs from Ptenfl/fl mouse were transfected with AAV2- Cre-GFP to delete Pten gene. One week after culture, neurospheres fromNSCs transduced with AAV2-Cre-GFP were harvested for western blot analysis and compared to those from the control AAV2-GFP treatment group (Figure 1A). Cultured mouse NSCs were found to have a substantial level of PTEN expression. Consistent with the PTEN expression, phosphorylation of 40S ribosome protein S6, which is a direct substrate of S6 kinase and a reliable marker of mTOR activation (Yang et al., 2014), was markedly suppressed in control NSCs. We confirmed that PTEN expression was completely abolished by AAV2-Cre-GFP transduction. Pten deletion resulted in an unequivocal increase in the level of S6 phosphorylation (Figure 1A). Neurosphere assay was performed one week after viral transduction. The average number of neurospheres was significantly increased by Pten deletion (Figure 1B and C). However, the average size of individual neurospheres was not significantly different between the two groups (Figure 1B and C). To determine whether Pten deletion enhances the capacity of NSC-derived neurons to grow neurites in culture, Pten-deleted NSCs were induced to differentiate by serum exposure and growth factor withdrawal and allowed to grow neurites on a laminin-coated substrate for 7 days. The lengths of βIII tubulin-positive neuronal processes were measured to obtain the mean neurite length for each NSC-derived neuron. We found that the deletion of Pten resulted in a nearly threefold increase in neurite length (Figure 1D and E). Injury to the spinal cord elicits upregulation of various extracellular matrices (ECMs) that strongly inhibit axonal regeneration (Hussein et al., 2020). We examined whether the neurite outgrowth from NSC-derived neurons was also affected by a substrate containing chondroitin sulfate proteoglycans (CSPGs), one of the potent inhibitors for axon growth. Indeed, neurite outgrowth from NSCderived neurons was robustly attenuated on a CSPG-containing substrate in both AAV2-GFP and AAV2-Cre treatment groups (Figure 1D and E). Importantly, the extent of the neurite outgrowth from Pten-deleted NSCs was almost two times larger than that from control NSCs, suggesting that Pten deletion from NSCs may overcome the inhibitory influence of extracellular matrix on axonal growth in an injury environment. To evaluate the capacity of NSCs to survive in an environment mimicking the injury condition, NSCs were treated with NaAsO2 to induce cellular stress (Streit et al., 2022), and cell survival was measured using an MTT assay. NaAsO2 treatment substantially reduced NSC survival in both control and Pten-deleted NSCs (Figure 1F). However, the percent cellular survival of Ptendeleted NSCs was higher than that of control NSCs (47.6% ± 0.6% vs. 61.2% ± 1.1%, NSCs with control AAV-GFP and AAV-Cre, respectively). Two-way ANOVA demonstrated the statistical significance of Pten deletion effect on NSC survival (F(1, 12) = 19.31, P < 0.001), and post hoc Bonferroni test revealed a significant difference in cell survival between control and Pten-deleted NSCs following NaAsO2 treatment (P < 0.01), supporting a notion that Pten deletion exerts protective influence on NSCs against degeneration-inducing stresses. We further evaluated the extent of cell death by fluorescence cell death staining followed by a flow cytometric analysis. The percentage of dying NSCs in response to NaAsO2 treatment was reduced from 48.1% ± 1.8% to 36.7% ± 1.4% by Pten deletion, which was statistically significant by two-way ANOVA followed by post hoc Bonferroni test (P < 0.05).
Figure 2 | Pten deletion enhances the survival and migration of grafted NSCs in vivo.
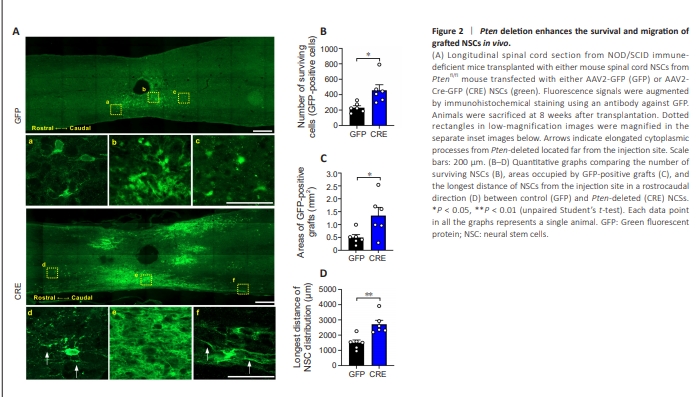
To examine the influence of Pten deletion on grafted NSCs in vivo, we transplanted NSCs obtained from Ptenfl/fl-EYFP mice and transduced with AAV2-Cre into the spinal cord of immunodeficient NOD/SCID mice one week after contusion injury, and the fate of the Pten-deleted NSCs was compared to that of control NSCs (transduced with AAV2-GFP). Although all NOD/ SCID mice transplanted with either control or Pten-deleted NSCs showed a variable degree of surviving NSCs, animals transplanted with Pten-deleted NSCs showed a significantly higher rate of grafted NSC survival than those with control NSCs (P < 0.05; Figure 2A and B). NSCs with Pten deletion frequently showed extensive graft survival and were frequently overlapped with neighboring NSCs (Figure 2A, inset e), making it difficult to precisely count the number of individual NSCs. Therefore, we also quantified the areas occupied by GFP immunoreactive grafts on a low-magnification image. The difference in this measure resulted in a more dramatic difference between the two groups (Figure 2C). We also observed that Pten-null NSCs tended to distribute more extensively along the rostrocaudal axis (Figure 2A). NSCs with Pten deletion were frequently observed up to a couple of millimeters from the initial cell transplantation site, whereas most of the control NSCs were located within one millimeter (Figure 2A). The average longest distance of longitudinal distribution of NSCs with Pten deletion was significantly longer than that of control NSCs (P < 0.01; Figure 2D). In this group, NSCs located farthest from the injection site frequently exhibited elongated cytoplasmic processes (Figure 2A, inset d and f, white arrows). In contrast, there were no prominent elongated processes from control NSCs observed far from the injection site (Figure 2A, inset a and c).
Figure 3 | Differentiation of NSCs with Pten deletion in injured spinal cord.
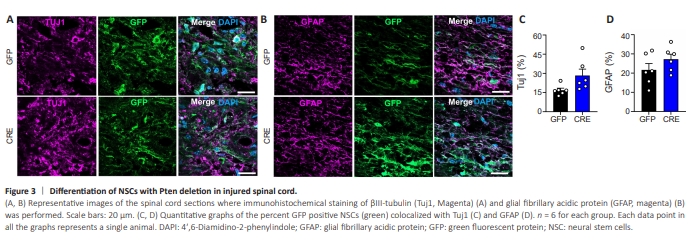
We also examined if Pten deletion influenced the extent of grafted NSC differentiation within the injured spinal cord. Only a proportion of GFP-positive NSCs, either control or Pten-deleted,were colocalized with a neuronal marker Tuj1 (Figure 3A). The extent of astrocytic differentiation of NSCs was slightly higher than that of neuronal differentiation, but still more NSCs were not exactly colocalized with an astrocytic marker GFAP (Figure 3B). When we quantified the percentage of GFP-positive NSCs colocalized with Tuj1 and GFAP, there was no significant difference between control and Pten-deleted NSCs (Figure 3A–D), indicating that Pten deletion did not significantly affect the differentiation capacity of NSCs. We also assessed the influence of NSC grafts on host tissue degeneration (measured by cavity formation) and astrocytic glial scarring. The increase in NSC graft survival by Pten deletion did not significantly change the extent of astrocytic scarring evaluated by GFAP immunoreactivity (Additional Figure 1A and B). In mice, contusion injuries typically do not lead to the formation of cavities (Byrnes et al., 2010). We did not observe a significant difference in the cavity volume between mice that received control and Ptendeleted NSC grafts (Additional Figure 1A and C). There was no evidence of tumor formation in all animals transplanted with either control or Ptendeleted NSCs.
Figure 4 | Influence of shRNA-mediated Pten silencing on rat NSCs in vitro.
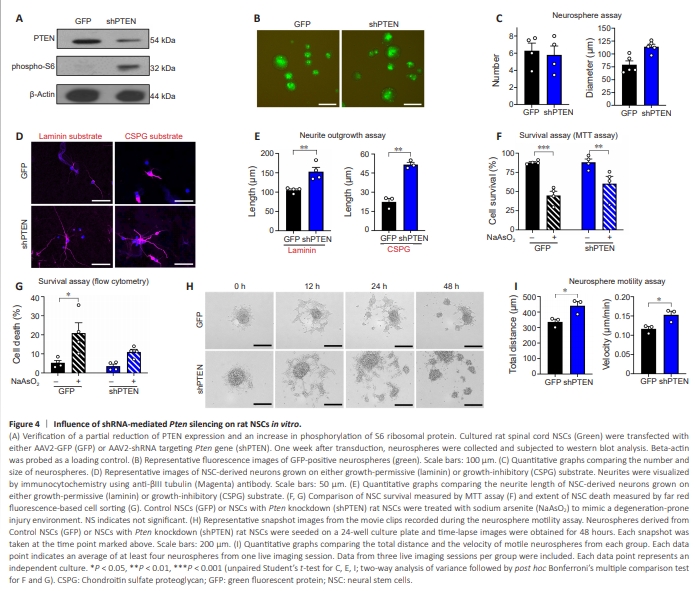
Having confirmed that the complete Pten deletion using a transgenic mouse line could increase the survival and potentially enhance the neurite growth from the grafted NSCs, we wanted to examine if partial suppression of Pten gene using an RNA inhibition approach may also produce similar benefits. To decrease the level of PTEN expression, NSCs obtained from E14 rat embryonic spinal cords were transfected with AAV2 expressing short hairpin RNA (shRNA) targeting Pten gene. We confirmed a substantial but partial reduction in the expression of PTEN protein in rat NSCs treated with AAV2-shPTENGFP compared to that in NSCs transduced with control AAV2-GFP (Figure 4A). Pten knockdown also led to phosphorylation of S6 ribosomal protein (Figure 4A), indicating activation of mTOR downstream signaling pathway by Pten silencing. At 7 days after treatment of AAVs, there was no significant difference in the number of neurospheres obtained from NSCs with and without Pten knockdown (Figure 4B and C). There was a tendency of NSCs with Pten knockdown to form bigger neurospheres compared to control NSCs. However, there was no statistical significance between the two conditions (Figure 4B and C). Neurite outgrowth from the NSC-derived neurons was examined following shRNA-mediated Pten silencing. Transfected NSCs were seeded on laminin or CSPG-coated coverslips. We assessed the extent of neurite elongation from βIII tubulin-positive neurons differentiated from NSCs at 7 days after plating. Pten suppression by shRNA targeting Pten gene enhanced neurite outgrowth by more than 1.5 folds above the control level on laminin substrate (Figure 4D and E). Pten knockdown promoted neurite growth more potently (by 2.5 folds) on inhibitory CSPG-coated surfaces (Figure 4D and E).We further elucidated the effects of PTEN suppression on NSC survival. In MTT cell survival assay, treatment with NaAsO? reduced cell survival by almost 50% in control NSCs. Pten knockdown partially attenuated NaAsO2-induced decrease in cell survival (44.9 ± 5.6 vs. 60.3 ± 9.5 in AAV-Cre and AAV-shPTEN NSCs, respectively) (Figure 4F). However, the effect of Pten knockdown on cell survival was not statistically significant by two-way ANOVA (F(1,12) = 1.752, P = 0.21). NaAsO2 treatment significantly increased the fraction of brightly stained dead cells in the control AAV2-GFP group evaluated by a flow cytometric analysis. Pten knockdown diminished the dead cell fraction (20.9% ± 5.4% vs. 11.0% ± 1.4%), and the effect of NaAsO? treatment on the percentage of dying NSCs became non-significant in NSCs with AAV2-shPTEN (P = 0.25 by two-way ANOVA followed by Bonferroni’s post hoc analysis; Figure 4G). Since we observed an increase in the extent of rostrocaudal migration of mouse NSCs with Pten deletion, we examined the influence of Pten suppression on the motility of NSCs. Our previous study reported IGF-1 signaling-dependent motility of cultured neurospheres (Hwang et al., 2018). Consistent with the report, NSCs transduced with control AAV2-GFP exhibited dynamic changes in their position and outer morphology accompanied by the creation of daughter neurospheres during the 48-hour live imaging session (Figure 4H and Additional Movie 1). Pten knockdown in NSCs led to a higher degree of neurosphere movement with more frequent splitting into daughter neurospheres (Figure 4H and Additional Movie 2). Quantification revealed a significant increase in the total distance and velocity of cultured neurospheres by transduction of AAV2-shPTEN (Figure 4I), indicating that the suppression of Pten may promote the NSC motility and potentially enhance the migratory behavior.
Figure 5 | Influence of shRNA-mediated Pten silencing on the survival of NSC grafts in vivo.

To evaluate whether Pten knockdown can enhance the engraftment potential of NSCs in vivo, we transplanted rat NSCs transfected with AAV2-GFP or AAV2-shPTEN-GFP one week after a moderate contusion injury to T10 level in rats (Figure 5A and B). At 2 weeks following transplantation, 6 out of 9 animals with control NSCs showed evidence of surviving grafts (Figure 5C). The graft success rate of animals transplanted with Pten-suppressed NSCs was comparable. However, the number of GFP-positive NSCs among animals with successful grafts was significantly higher in the Pten-knockdown NSC transplantation group (Figure 5A and E). Furthermore, surviving NSCs with Pten suppressed exhibited more elongated morphology compared to control NSCs. Measurement of cellular processes revealed an almost 4-fold increase in the mean length of cellular processes per grafted NSC (Figure 5E). At 8 weeks post-transplantation, the rate of successful engraftment fell below 50% in animals with control NSCs, indicating that grafted NSCs continued to be lost between 2 and 8 weeks (Figure 5D). However, the graft success rate was comparable between the two points for animals with Pten-knockdown NSCs. The number of surviving NSCs at 8 weeks was substantially higher in the Pten-knockdown NSC group (Figure 5B and F). The mean length of cellular processes was also significantly larger in animals with Pten-knockdown NSCs at this time point (Figure 5F). Intriguingly, cellular processes for Ptenknockdown NSCs at 8-week were twice as long as those at 2 weeks (means length per NSC, 4543 ± 918.0 μm vs. 2140 ± 568.5 μm), whereas the meanlength of cellular processes for control NSCs was comparable between 8 and 2 weeks (553 ± 294.3 μm and 598 ± 40.2 μm, respectively) (Figure 5E and F). When we examined whether the increase in NSC survival may affect the glial scarring, there was no significant difference in the extent of GFAP immunoreactivity surrounding the lesion border between control NSCs and NSCs with shPTEN (Additional Figure 2A and B). Compared to the mice spinal cord lesions (Additional Figure 1A), large cavitary lesions were frequently observed in rats. However, we did not observe the influence of NSCs with shPTEN on the volume of lesion cavities (Additional Figure 2A and C). We also examined whether the increase in the number of grafted cells in the Pten-knockdown NSC group was correlated with the amount of host axons interacting with the grafted NSCs. When we visualized the brainstem-derived serotonergic axons using antibodies against 5-HT, the extent of 5-HT axons within the injury epicenter was comparable between the control and Ptenknockdown NSC groups (Figure 5G). Since there were more GFP-positive NSCs in animals with Pten-knockdown NSC graft group, however, the number of 5-HT positive buttons colocalized with NSCs was much higher in this group (Figure 5G), indicating an increase in the extent of interaction between host axons and grafted NSCs.
Figure 6 | Pten silencing leads to extensive migration of NSCs and elongation of neurites from NSC-derived neurons in vivo.
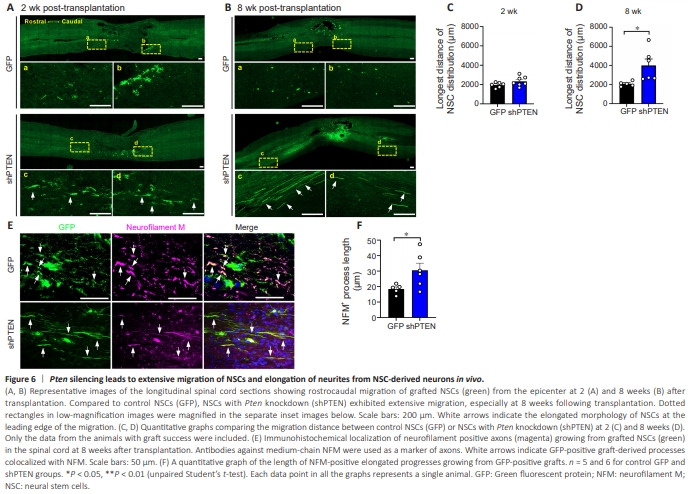
Since we observed an increase in NSC motility by Pten knockdown in vitro, we measured the longest distance of grafted NSC migration in the injured spinal cord. At 2 weeks post-transplantation, the extent of the rostrocaudal distribution of control NSCs was approximately 2 mm (Figure 6A). NSCs with Pten knockdown seemed to move further in the rostrocaudal direction, but the average longest migration distance was not significantly different (Figure 6A and C). However, GFP-positive NSCs were positioned in a direction aligned with the rostrocaudal direction of the spinal cord. Furthermore, individual NSCs with shPTEN were of a more elongated morphology than that of wildtype NSCs (Figure 6A). At 8 weeks post-transplantation, the rostrocaudal distribution of the small number of surviving control NSCs was almost the same as the distance at 2 weeks, suggesting that NSCs did not migrate significantly between these two time points (Figure 6B and D). In contrast, NSCs with shPTEN exhibited substantially more extensive distribution in the rostrocaudal direction, showing that the average migration distance was significantly higher than that of control NSCs (Figure 6B and D). Intriguingly, GFP-positive NSCs transduced with AAV2-shPTEN, but not AAV2-GFP, frequently exhibited highly elongated morphology with parallelly running cytoplasmic processes at the leading edge of migration (Figure 6B). The average length of neurofilament positive processes derived from GFP-positive cells was markedly higher in animals transplanted with NSCs with Pten knockdown (Figure 6E and F), suggesting that PTEN suppression promoted neurite elongation from NSC-derived neurons. There was no evidence of tumor formation in all 38 animals transplanted with either control NSCs or NSCs with Pten knockdown. Two recipients of NSCs with Pten knockdown were allowed to survive up to 9 months following transplantation and neither one developed tumor at the graft site.