脑损伤
-
Figure 1 | Lnc_011797 is upregulated in cells subjected to OGD.
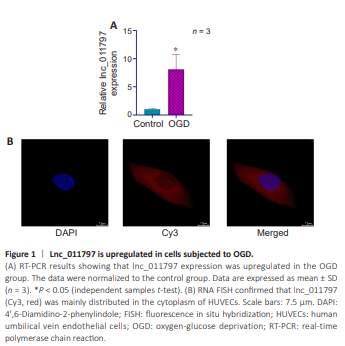
In our previous study (Xu et al., 2023b), through RNA sequencing, we found that lnc_011797 is a biomarker of WMLs whose expression level is related to disease severity. To verify that lnc_011797 is involved in WMLs, we subjected HUVECs to OGD to create an in vitro model of WMLs (Choi et al., 2017) and measured lnc_011797 expression by RT-PCR. Compared with the control group, lnc_011797 expression in the OGD group was significantly greater (P = 0.04; Figure 1A). This finding is consistent with our sequencing results. Next, RNA FISH was used to investigate the subcellular localization of lnc_011797. We found that lnc_011797 localized mainly to the cytoplasm (Figure 1B). CPAT database analysis indicated that lnc_011797 has no coding potential (Table 2).
Figure 2 | OGD induces ferroptosis in HUVECs.
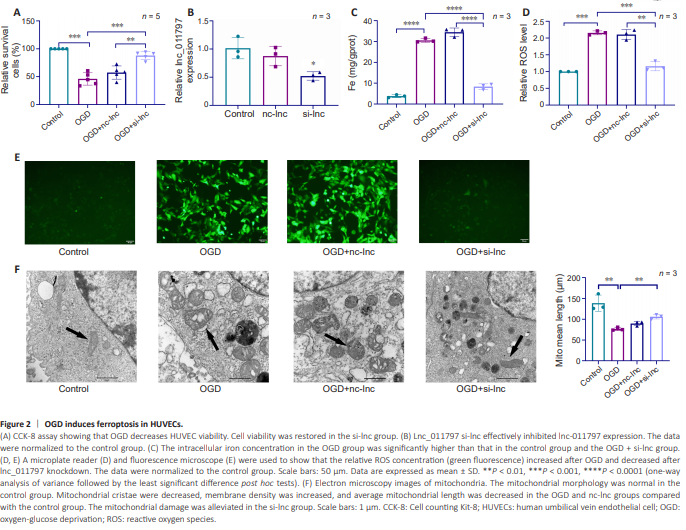
To further investigate the role of lnc_011797 in ferroptosis, we transfected cells with lnc_011797-silenced lentivirus (si-lnc). lnc_011797 expression was successfully reduced in the si-lnc transfected cells compared with the control and nc-lnc groups (Figure 2A). Previous studies have shown that OGD can lead to ferroptosis (Yuan et al., 2021; Liao et al., 2023a); therefore, we next tested cell viability using a CCK-8 kit and found that OGD significantly decreased cell viability (P = 0.0004; Figure 2B). Moreover, silencing lnc_011797 improved the viability of cells subjected to OGD (Figure 2B). Then, we used TEM, intracellular iron concentration detection, and ROS level detection to determine whether ferroptosis occurred in cells subjected to OGD. The intracellular iron concentrations and ROS levels in the OGD group were greater than those in the control group (Figure 2C–E). TEM showed that the mitochondrial crest decreased or disappeared, the mitochondrial membrane density increased, and the mean mitochondrial length were decreased in the OGD group compared with the control group (Figure 2F). These findings indicate that OGD induces ferroptosis and decreases cell viability. However, the intracellular concentration of iron in the OGD + si-lnc group was lower than that in the OGD group (Figure 2C). Furthermore, lnc_011797 knockdown reversed the increase in ROS levels caused by OGD (Figure 2D and E). When lnc_011797 expression was knocked down, OGD-induced mitochondrial lesions were milder (Figure 2F). Thus, decreased lnc_011797 expression was associated with ferroptosis inhibition, suggesting that lnc_011797 regulates ferroptosis.
Figure 6 | Lnc_011797 promotes WML formation in C57BL/6J mice.
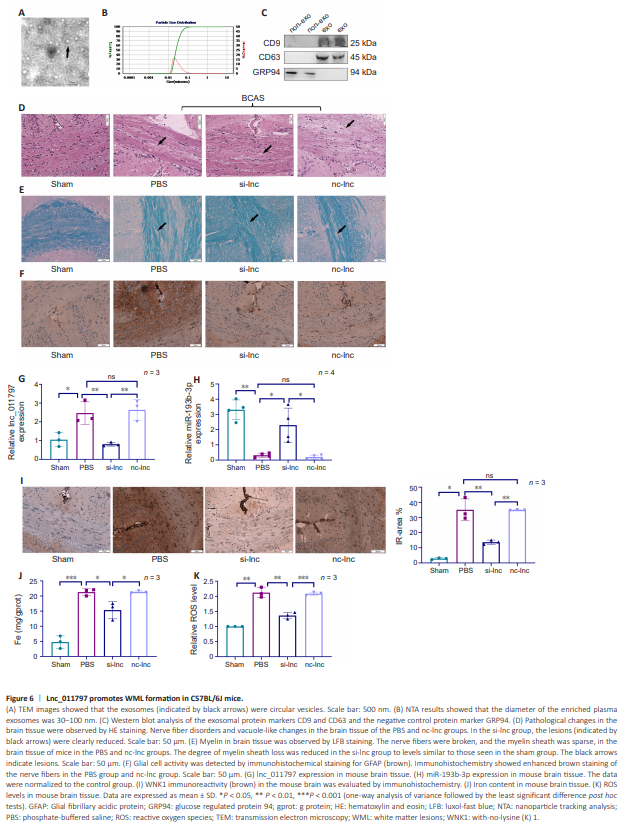
Next, we sought to validate our in vitro data in a C57BL/6J mouse model of WMLs. First, exosomes were extracted from cells subjected to lnc_011797 knockdown or from negative control cells. Then, the exosomes were identified and evaluated by TEM, nanoparticle tracking analysis, and western blotting. TEM analysis of the exosomes revealed that they exhibited a circular shape and a size of approximately 100 nm (Figure 6A). Nanoparticle tracking analysis was used to analyze the size distribution of the exosomes in the range of 30–100 nm (Figure 6B). Western blot analysis revealed that the exosomes contained typical proteins (CD9 and CD63) but lacked cellular proteins (GRP94) (Figure 6C). Together, these findings indicate that we successfully isolated exosomes from cultured HUVECs (Théry et al., 2018). As shown in Additional Table 5, the neurobehavioral scores in the BCAS group were significantly lower than those in the sham group 1 month after surgery (P = 0.015). However, the neurobehavioral scores in the si-lnc group were higher than those in the BCAS group (Additional Table 5). HE and LFB staining demonstrated successful establishment of a mouse model of WMLs by inducing BCAS (Figure 6D and E). Exosomes were injected into the tail vein. To verify the effect of lnc_011797 knockdown on WMLs after BCAS, HE and LFB staining of brain tissue was performed. HE staining revealed disorganized nerve fibers and vacuole-like changes in the mouse brain tissue after BCAS. However, these pathological changes were considerably reduced in the si-lnc group compared with the PBS group and the nc-lnc group (Figure 6D). LFB staining revealed myelin loss, severe damage to the myelin sheath, nerve fiber disruption, and sparse myelin sheaths in mouse brain tissue after BCAS (Figure 6E). The degree of myelin loss in the si-lnc group was lower than that seen in the PBS and nclnc groups (Figure 6E). Next, to assess the effect of lnc_011797 deletion on the glial cell response to BCAS, we performed immunohistochemical analyses using an anti-GFAP antibody. BCAS clearly increased the area of the immune response, as indicated by GFAP staining. Moreover, the size of the GFAPpositive area decreased when lnc_011797 expression was inhibited (Figure 6F). Therefore, we successfully established a mouse model of WMLs and showed that lnc_011797 knockdown reduced histological damage to the white matter in this model. lnc_011797 expression in the brain was measured by RT-PCR. As shown in Figure 6G, lnc_011797 expression in the brain after BCAS was significantly increased (P = 0.03), consistent with our previous study’s results. lnc_011797 expression in the brain of mice decreased after injection of si-lnc exosomes into the tail vein (Figure 6G), demonstrating that the exosomes successfully penetrated the blood–brain barrier to affect lnc_011797 expression in the brain. In addition, miR-193b-3p expression was significantly downregulated in brain tissue after BCAS (P = 0.002; Figure 6H), and inhibiting lnc_011797 expression increased miR-193b-3p expression (Figure 6H). Next, we examined WNK1 levels in the brain. Immunohistochemical analysis showed that WNK1 expression increased after BCAS treatment (Figure 6I) and decreased in the si-lnc group compared with the PBS and nc-lnc groups (Figure 6I). Therefore, lnc_011797 affects WMLs through the miR-193b-3p/WNK1 signaling pathway. To further demonstrate that lnc_011797 causes WMLs by promoting ferroptosis, we detected iron concentrations and ROS levels at WMLs sites. The levels of iron and ROS at WMLs sites after BCAS were greater than those in the sham group (Figure 6J and K). Furthermore, the concentrations of iron and ROS in the lncRNA_011797 knockdown group were markedly lower than those in the PBS and nc-lnc groups (Figure 6J and K).