脑损伤
-
Figure 1 | Reduction of radiationinduced brain lesion volume and increase of neuronal density after ND1 treatment.
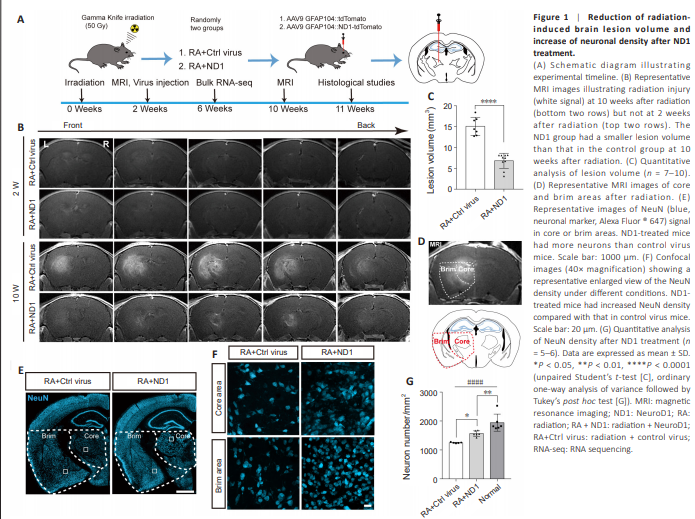
To investigate the therapeutic effect of in situ neuronal regeneration in an RIBI mouse model, we used MRI at 2 weeks and 10 weeks after modeling. Bulk RNA-seq was performed at 6 weeks after modeling. Histology evaluation was performed on samples collected at 11 weeks post-modeling (Figure 1A). The MRI results showed no significant radiation injury lesions in either group at 2 weeks after modeling. However, the lesion volume in the ND1-treated group was significantly smaller than that in the control virus group at 10 weeks after modeling (Figure 1B and C). We performed immunostaining for GFAP, a marker of reactive astrocytes (Galland et al., 2019), which showed that the GFAP-positive area was significantly larger in the control virus group than in the ND1-treated group at 11 weeks after modeling (Additional Figure 1A and B). On the basis of the MRI and GFAP staining results, we divided the radiation injury region into a core area and a brim area. The core area was defined as the thalamic region below the hippocampus, and the brim area included the cortical area lateral to the core area and below the lower edge of the hippocampus (Figure 1D and Additional Figure 1C). GFAP+ reactive astrocytes were spreading in both the core and brim areas in the control virus group, whereas in the ND1 group, GFAP+ reactive astrocytes were observed in only the core area (Additional Figure 1A).Subsequently, we measured the density of NeuN (a marker for neurons) in the core and brim areas of the thalamus in both groups (Figure 1E and F). The neuronal density in the control virus group, ND1-treated group and normal mice were significantly different (Figure 1G); the neuronal density in the control virus group was significantly lower than that in the ND1-treated group. However, the neuronal density in the ND1-treated group was still significantly lower than that in normal mice (Figure 1G). These results suggest that ND1 treatment reduced the lesion volume and increased the neuronal density in the lesioned area of the RIBI mouse model.
Figure 2 | ND1 mediates astrocyte-to-neuron conversion.

To confirm whether in situ neuronal regeneration converts reactive astrocytes into neurons by overexpressing ND1 transcription factor in astrocytes of the RIBI mouse model, we examined the expression of tdTomato (a fluorescent protein for adeno-associated virus), S100 calcium-binding protein B (S100β, a marker for astrocytes) (Galland et al., 2019), NeuN (Gusel’nikova and Korzhevskiy, 2015) and ND1. In the control virus group, tdTomato expression was spreading in both the core and brim areas (Figure 2A, top panel), while, in the ND1-treated group, tdTomato expression was observed in only the core area (Figure 2A, bottom panel), similar to the pattern found with GFAP+ reactive astrocytes shown in Additional Figure 1A. In addition, in the control virus group, the tdTomato+ cells in both the core and brim areas (Figure 2B) colocalized with S100β at a rate of 95.2% ± 2.5% (Figure 2C), and did not colocalize with NeuN. The left two columns of Figure 2B show a confocal orthogonal view, providing more details of the colocalization of S100β and tdTomato. By contrast, in the ND1-treated group, tdTomato+ cells in the core area did not colocalize with S100β (Figure 2D, left two columns) and there was no tdTomato expression in the brim area (Figure 2D, right two columns). These results indicate that tdTomato+ cells in the lesion areas of the control virus group were still astrocytes, whereas tdTomato+ cells in the ND1-treated areas were no longer astrocytes at 11 weeks after RIBI modeling. No ND1 protein expression was observed in either the core or brim areas (Figure 2E) in the control virus group. In the ND1-treated mice, there was no expression of ND1 or tdTomato in the brim area of the lesion (Figure 2F, right two columns). However, tdTomato+ cells in the core area colocalized with both ND1 and NeuN (Figure 2F, left two columns), with a colocalization (NeuN+ tdTomato+ ) rate of 36.4% ± 13.2% (Figure 2G). In the control virus mice, tdTomato+ cells did not colocalize with NeuN (Figure 2G). These results suggest that ND1 overexpression converted tdTomato+ astrocytes into NeuN+ neurons. We further analyzed the number of transdifferentiated neurons and endogenous neurons in the different groups. As shown in Figure 2H, the endogenous neuronal density in the lesion area of the ND1-treated mice (NeuN+ tdTomato– ) was significantly higher than that of the control virus group (NeuN+ ). The total neuronal density in the ND1-treated mice increased to 1568 ± 93.1 cells/mm2 , which was significantly higher than that of the control virus group mice, but lower than the 1944 ± 297.2 cells/mm2 in normal mice (Figure 1G). These results suggest ND1 overexpression not only induced transdifferentiation but also protected the endogenous neurons.
Figure 3 | ND1 overexpression improves the microenvironment of the injured core area in the RIBI mouse model.
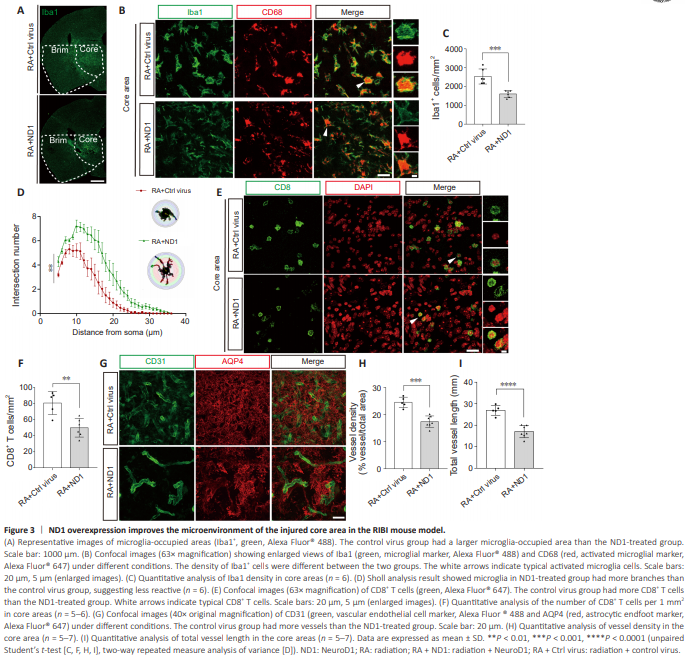
To clarify the neuroprotective effect of ND1 overexpression, we further investigated the microenvironment around the injured neurons in the RIBI mice. First, we observed the effect of ND1 overexpression on microglial activation. Figure 3A shows the expression of ionized calcium binding adaptor molecule 1 (Iba1), a marker for microglia (Hendrickx et al., 2017), in the core and brim areas of the lesion in different groups. As shown in Figure 3B and D, the morphology of the microglia in the control virus group were often round in shape (top row), suggesting reactive, whereas in the ND1-treated group, microglia had more branches (bottom row), suggesting less reactive (P = 0.0099, two-way repeated measure analysis of variance). The density of Iba1+ cells in the core area of the ND1-treated group was significantly higher than that in the control virus group (Figure 3C). Moreover, the mean fluorescenceintensities of both Iba1 and cluster of differentiation 68 (CD68), a marker for microglia activation (Hendrickx et al., 2017), in the core area and the brim area of the control virus group were significantly higher than those in the ND1-treated group (Additional Figure 1D–H). These results suggest that ND1 overexpression decreased microglial activation in the lesion regions of RIBI mice. Given that our previous study showed an increase in cytotoxic CD8+ T cell infiltration mediated by microglial activation in the lesion area of mice with RIBI (Shi et al., 2023a), we subsequently examined the infiltration of CD8+ T cells in the brain parenchyma (Figure 3E). The density of CD8+ T cells in the thalamus of the control virus group was 80.6 ± 14.3 cells/mm2 , significantly higher than 49.8 ± 11.6 cells/mm2 in the ND1-treated mice (Figure 3F). These results suggest that ND1 overexpression decreased the infiltration of CD8+ T cells in the lesion regions of RIBI mice. In addition to microglial activation and CD8+ T cell infiltration, BBB disruption is a typical pathological feature of RIBI (Ali et al., 2019). Radiation increases the release of vascular endothelial growth factor and causes incomplete angiogenesis, which disrupts the BBB (Cheng et al., 2023). Therefore, we examined blood vessels using aquaporin 4 (AQP4), which is located in the astrocyte endfoot and wraps around blood vessels, contributing to the BBB (Nagelhus and Ottersen, 2013), and platelet endothelial cell adhesion molecule-1 (PECAM-1/CD31), a marker for vascular endothelial cells. Figure 3G shows the co-staining of AQP4 and CD31 in the core area in different groups. We observed microvascular dilation in the injury site of the RIBI mice, consistent with our previous findings (He et al., 2020). The control virus group and ND1-treated group exhibited a loss of AQP4 polarity, with AQP4 no longer wrapping around the blood vessels. Moreover, the vascular density and total vascular length were significantly higher in the control virus group than in the ND1-treated group (Figure 3H and I). There were no significant differences in vascular density and total vascular length between the two groups in the brim area (Additional Figure 1I–K). These results suggest that ND1 treatment reduced angiogenesis in the RIBI model mice, thereby improving the BBB integrity.
Figure 6 | In vivo conversion of astrocytes into neurons in the thalamus of hemorrhagic stroke mouse brain.
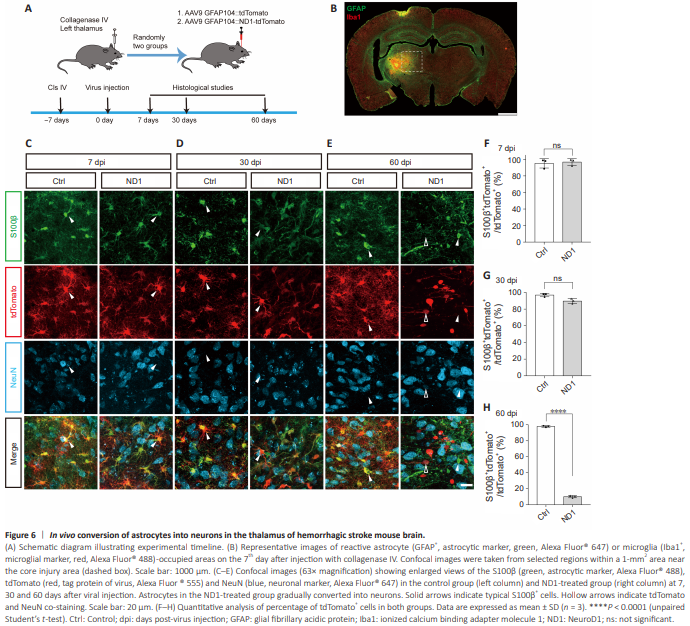
Hemorrhagic stroke is an acute cerebrovascular disease in which brain tissue is damaged because of sudden obstruction of blood flow or rupture of blood vessels in the brain tissue, which subsequently leads to delayed brain injury (Ohashi et al., 2023). Histopathology evaluations were performed at 7, 30, and 60 days post-virus injection (dpi) (Figure 6A) within a 1-mm2 area adjacent to the cavity (Figure 6B). We performed co-staining for S100β, tdTomato and NeuN to examine the conversion of the astrocytes into neurons after overexpressing ND1 in the control virus group (Ctrl) and ND1-treated group (ND1). At 7 dpi, the tdTomato+ cells were co-labeled with S100β but not with NeuN in both the Ctrl and ND1 groups (Figure 6C and F), which indicated that the tdTomato+ cells were still astrocytes at 7 dpi. At 30 dpi, tdTomato+ cells in the Ctrl group were still co-labeled with S100β but not with NeuN (Figure 6D and G). In the ND1 group, although most of the tdTomato+ cells were still colabeled with S100β and not with NeuN, the co-labeling rate (89.7% ± 3.0%) was slightly lower compared with that at 7 dpi (96.8% ± 4.1%). These results suggest a trend that a small proportion of tdTomato+ cells had become nonastrocytes at 30 dpi in the ND1-treated group. At 60 dpi, tdTomato+ cells were co-labeled with S100β in the Ctrl group. In the ND1 group, tdTomato+ cells were sparsely co-labeled with S100β and were co-labeled with NeuN. These results suggest most of the tdTomato+ cells in the ND1-treated group had become non-astrocytes, with some of them converting into neurons at 60 dpi (Figure 6E and H). These results suggest that the tdTomato+ astrocytes gradually converted into neurons after ND1 overexpression.
Figure 7|Reactive astrocytes gradually converted into neurons by NeuroD1.

To determine whether the conversion of tdTomato+ astrocytes into neurons was mediated by the increased expression of ND1, we performed costaining for ND1, tdTomato and NeuN at 7, 30, and 60 dpi in a hemorrhagic stroke mouse model. In the Ctrl group, there was no ND1 expression and the tdTomato+ cells were not co-labeled with NeuN (Figure 7A–F). In the ND1 group, ND1 was expressed in tdTomato+ astrocytes and most of ND1 did not co-label with NeuN at 7 dpi (Figure 7A). The co-labeling rate of NeuN+ tdTomato+ was 1.8% ± 3.1% (Figure 7D). At 30 dpi, there was a slight increase in the co-labeling rate of NeuN+ tdTomato+ to 6.0% ± 3.9% (Figure 7B and E). At 60 dpi, tdTomato+ cells not only expressed ND1 but also were co-labeled with NeuN (Figure 7C), suggesting that these cells had transdifferentiated into neurons under the induction of ND1. The co-labeling rate of tdTomato+ NeuN+ was 31.7% ± 8.0% (Figure 7F), which indicated that the transdifferentiation induced by ND1 was a gradual increase.
Figure 8 | Reduction of i n f l a m m at i o n a f te r N D 1 treatment in hemorrhagic stroke mouse brain.
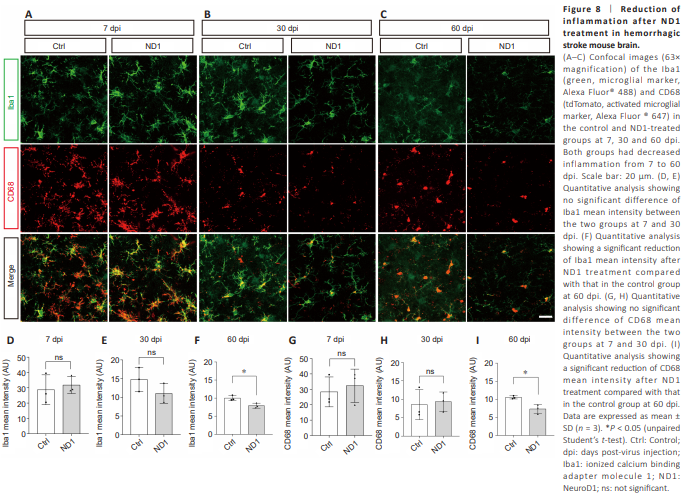
The hemorrhagic stroke brain injury includes two characterized timespans: the early brain injury period and the delayed brain injury period. The microglial phenotypes and functions during each phase serve a critical role in both promoting and attenuating hemorrhagic stroke-induced morbidity (He et al., 2021; Alsbrook et al., 2023). We examined the activation level of microglial cells by co-staining the microglial markers Iba1 and CD68. The staining results showed that both groups of mice exhibited gradually reduced microglial activation over time (7, 30, and 60 dpi; Figure 8A–C). Compared with those in the Ctrl group, the mean fluorescence intensities of both Iba1 and CD68 gradually decreased after ND1 treatment (Iba1, Figure 8D– F; CD68, Figure 8G–I). Moreover, statistical analysis at 60 dpi showed that the mean fluorescence intensities of both Iba1 and CD68 in the ND1 group were significantly lower than those in the Ctrl group (Figure 8C, F and I). These results suggest that microglial activation in the ND1-treated mice was significantly decreased at 60 dpi under the overexpression of ND1, and may be associated with its therapeutic effect. Additionally, we observed the vessels and did not show any vascular proliferation in the hemorrhagic stroke mouse model (Additional Figure 3A–I).