视神经损伤
-
Figure 1|Example of a reconstructed electrode track, shown on 40 μm tissue sections stained for Nissl (A) and cytochrome oxidase (B).

Twenty-seven electrode penetrations were completed in four marmosets. Sixteen were confirmed to be entirely located in area V2 based on histological reconstruction (Figure 1). The 130 neurons recorded in these tracks had receptive fields centered between 8° and 15° in the lower visual field, covering all polar angles between the horizontal and vertical meridians, as expected from previous studies (Rosa et al., 1997). After removing 20 neurons for which response levels were too low to allow fitting of tuning curves, 110 neurons were ultimately included in the analysis.
Figure 2|Tuning curves for different neurons in the second visual area of marmosets.

Examples of tuning curves for two different neurons are illustrated in Figure 2. The neuronal responses shown in Figure 2A are representative of a direction-tuned cell (DI2pt > 0.5) whereas those shown in Figure 2B show orientation selectivity, but did not fit the criterion for direction selectivity.
Figure 3|Visual response characteristics of neurons in the second visual area of marmosets
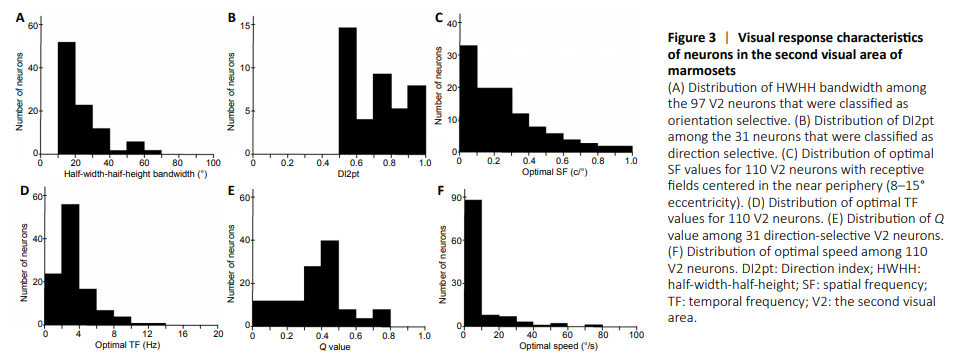
According to a circular variance criterion of < 0.9, 97 of the 110 neurons studied (88.2%) had orientation selectivity. The HWHH bandwidth in this sample varied between 11.77°–69.1°, with a median value of 19.65° (Figure 3A).
The distribution of direction indices (DI2pt) is illustrated in Figure 3B. According to a criterion of DI2pt > 0.5, 31 neurons (28.2%) had direction selectivity (e.g. Figure 2A). Among these neurons the average DI2pt was 0.72. No bias for specific ranges of directions was observed, with neurons showing preferences throughout the possible range (1°–359°) in approximately equal amounts.
Figure 3C shows the distribution of optimal SF for the 110 neurons in the sample, which, as described above, were centered in mid-peripheral eccentricities (8–15°). The minimum optimal SF value was 0.02 cycles per degree (c/°), and the maximum value was 2.0 c/°. The median value was 0.45 c/°, with the majority (n = 85, 77.3%) of neurons exhibiting values below 0.8 c/°.
The optimal TF in the same group of neurons ranged between 0.5 Hz and 13.8 Hz, with a median value of 2.83 Hz (Figure 3D). A large majority of neurons (n = 97, 88.2%) had optimal TF values below 6 Hz.
The Q value of most neurons (n = 72) was not significantly different from 0, indicating that the TF of the stimuli did not affect SF selectivity. We also investigated whether the sub-population of neurons with direction selectivity (n = 31) tended to show interaction between SF and TF. As shown in Figure 3E, the average Q value among this population was 0.37, compatible with a mild interaction. No neuron showed a Q value above 0.8, which in previous studies has been associated with speed selectivity (Lui et al., 2007; Yu et al., 2010). Thus, V2 neurons did not show the physiological characteristics associated with speed selectivity.Figure 3F illustrates the distribution of optimal speeds in the sample (n = 110), calculated using the equation, speed = TF/SF (Yu et al., 2010). The minimum optimal speed was 0.76°/s, the maximum 153.81°/s, and the median value was 9.14°/s.